
 Whatsapp
 Telegram
 2026-11-05
Gold Prices Hold Above the 20-Day Moving Average in the Short Term and Continue to Strengthen
Gold Market Analysis: “Gold Prices Hold Above the 20-Day Moving Average in the Short Term and Continue to Strengthen”
Completed on 11 May 2026, 10:31
The US Republican Party suffered a crushing defeat in the midterm elections. The Democrats have already secured 54 seats in the Senate and 239 in the House, regaining control of both chambers. Although vote counting is still ongoing, it is no longer significant. Financial markets reacted positively to the election results: the three major US stock indices surged, with the Dow Jones Industrial Average rising by more than 3%, while New York crude oil futures plunged by over 8%, falling as low as $87.14. US 10-year Treasury yields fell further, hitting a low of 4.843%, while gold prices rebounded sharply, breaking above the Gann 45-degree angle of $4,110 this morning. This situation is event-driven rather than driven by safe-haven demand.
The current performance of financial markets reflects a repricing of future price developments, in other words, speculation on expectations. However, I would still remind investors that the impact of the Democratic Party on the Trump administration will not take effect until January next year. Even so, Trump will still have two years in office, and he retains absolute control over certain policies, such as foreign affairs and military matters. As for the debt issue, if he is smart, he should raise the debt ceiling significantly during the remainder of this year to avoid another government shutdown. It is reported that the White House has already drawn up contingency measures in response to the possibility of losing control of Congress. Therefore, over the next two years, US domestic politics will not be as simple as imagining that “once the Democrats control Congress, everything will become better.”
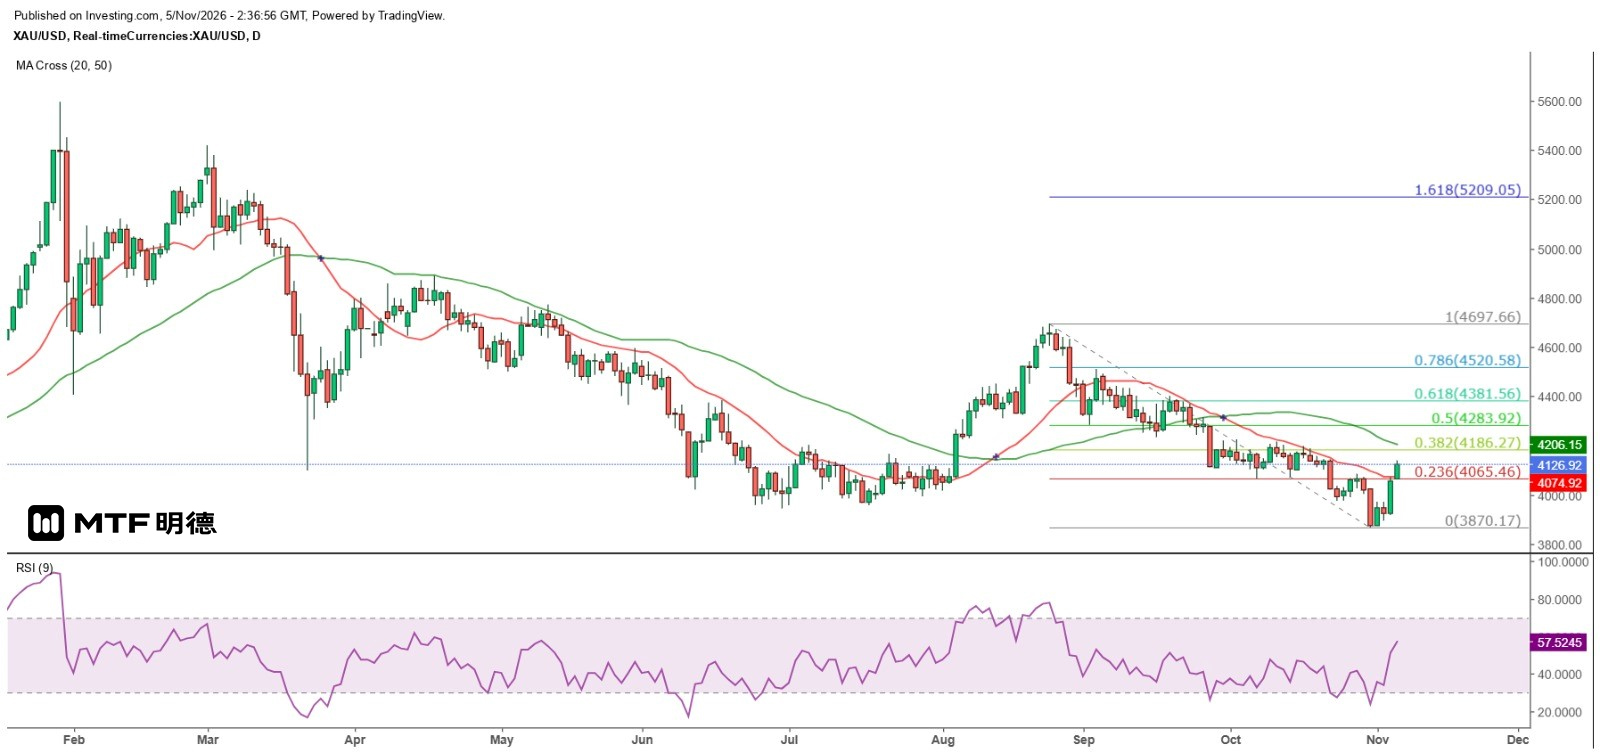
As for gold prices, from the daily chart, gold has now broken above the 20-day SMA at $4,075, but a close above this level for three consecutive days is required to confirm the breakout. Earlier, gold only fell to $3,870 and failed to reach the buy target of $3,810, but the trend remained in line with expectations. Since the price movements of gold and other financial assets are event-driven, under market logic, the rise in US interest rates will not pose an obstacle to the upward trend in gold prices in the short term. The decline in oil prices has reduced inflationary pressure, but this has not caused gold prices, so-called inflation hedges, to fall.
In the short term, the likelihood of gold prices rising further is relatively high, and buying on dips should be the main strategy. For now, the 20-day SMA on the daily chart is the first important support level. If gold prices retest this line, I believe there will be substantial buying support. However, $4,210 remains strong resistance. Even if the all-time high of $5,595 is used as the starting point for a Gann square calculation, gold prices would still encounter strong resistance at the 45-degree angle level of $4,245. If the rebound is calculated as 50% of the maximum decline since 25 August, gold prices could rise to $4,283.92.
The above content is for reference only and does not constitute investment advice.


