
 Whatsapp
 Telegram
 2026-08-31
 The gold price at $4,410 has strong support.
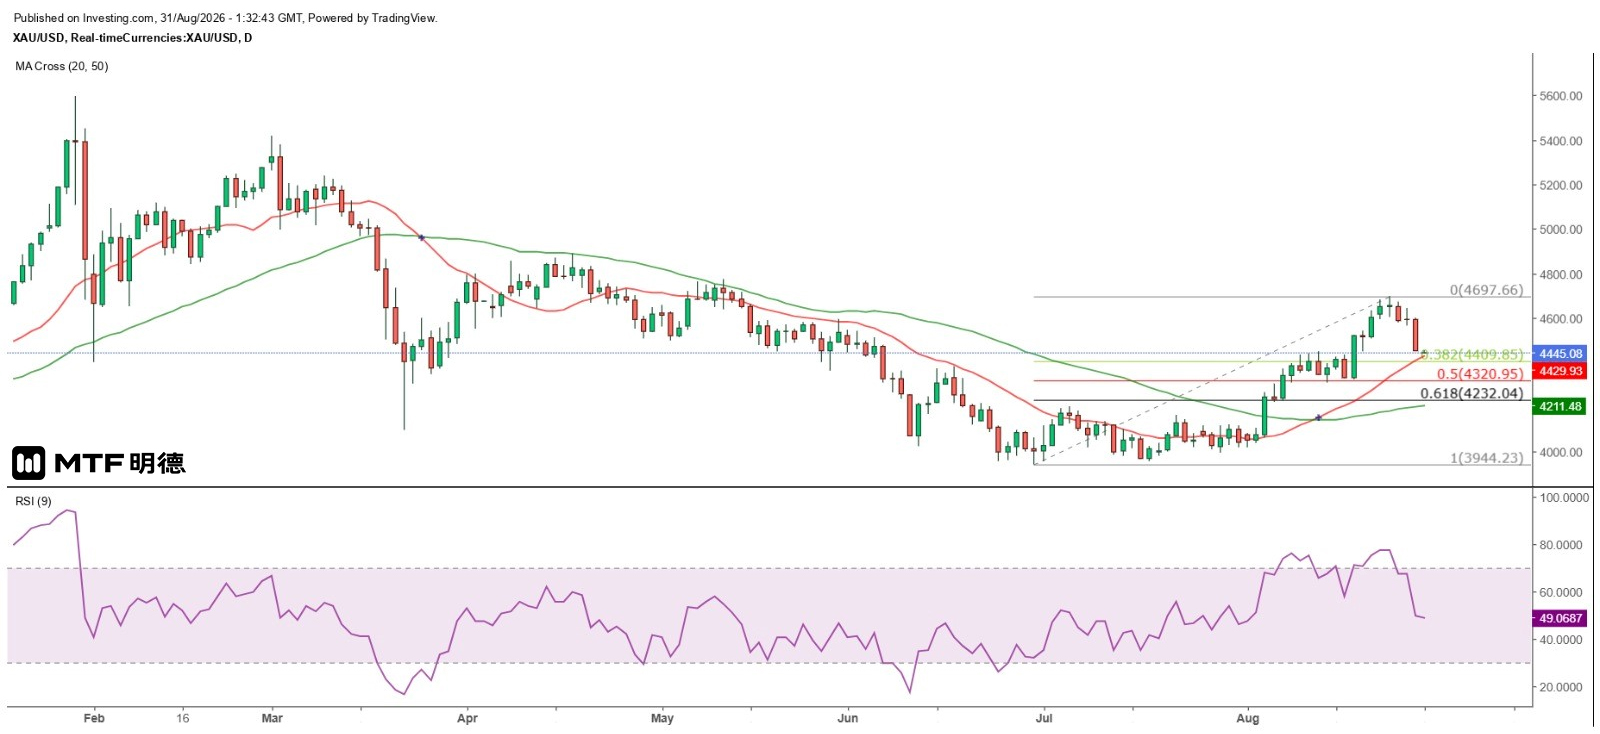
"Gold Price Supported Strongly at $4,410" – Completed on 31/8/2026 at 9:31
At the Jackson Hole Global Central Bank Symposium, Federal Reserve Chair Waller delivered a firm stance on inflation and monetary policy—exactly as I anticipated. He emphasized that bringing the personal consumption expenditure (PCE) inflation rate back to 2% is an "unwavering hard target." He noted that the Fed has failed to meet this goal for several consecutive months, and current inflation data remains concerning. Regarding the possibility of further rate hikes, he stated clearly that inflation is fundamentally a result of monetary policy choices. If core inflation does not decline toward the target quickly and with a clear direction, the central bank will not rule out additional tightening, adding that there is still work to be done.
On financial conditions, he argued that current monetary policy and the overall financial environment are not yet contractionary, nor have they significantly suppressed economic activity, leaving room for further tightening by the Fed. His remarks were interpreted by markets as a highly hawkish stance. Interest rate futures reflected a sharp rise in expectations for a 25-basis-point hike in September, jumping from under 40% a week earlier to 59.7%, with further expectations of another 25-basis-point increase in December. U.S. Treasury yields and the U.S. dollar index both surged. However, the U.S. Department of Labor will release the August non-farm payroll report this Friday, with forecasts pointing to job gains of just 58,000—still a relatively low figure. With midterm elections approaching and tensions between the U.S. and Iran temporarily easing, it is unlikely the Fed will choose to raise rates at this moment.
The spot gold price opened lower in today's Asian session, falling to a low of $4,442.21 before gradually recovering. However, after rebounding to $4,466.89, it turned lower again. On the daily chart, gold has approached the 20-day simple moving average (SMA) at $4,430. I believe this level offers short-term support; even if broken, a reversal pattern within a single day is likely. Using Fibonacci retracement on the move since June 30, a 38.2% correction would bring the price to $4,409.85. Given that Gann’s square vertical angle at 270 degrees lies at $4,410, this level is expected to remain a key short-term support. Cyclical analysis also suggests that gold may have bottomed out today, making further buying at these lows riskier. Therefore, I expect gold to trade within a range of $4,410 to $4,510 today.
The above information is for reference only and does not constitute investment advice.


