
 Whatsapp
 Telegram
 2026-08-19
 Gold prices may bottom out and rebound this Friday.
Gold Price May Bottom Out and Rebound This Friday
August 19, 2026, 10:48 AM
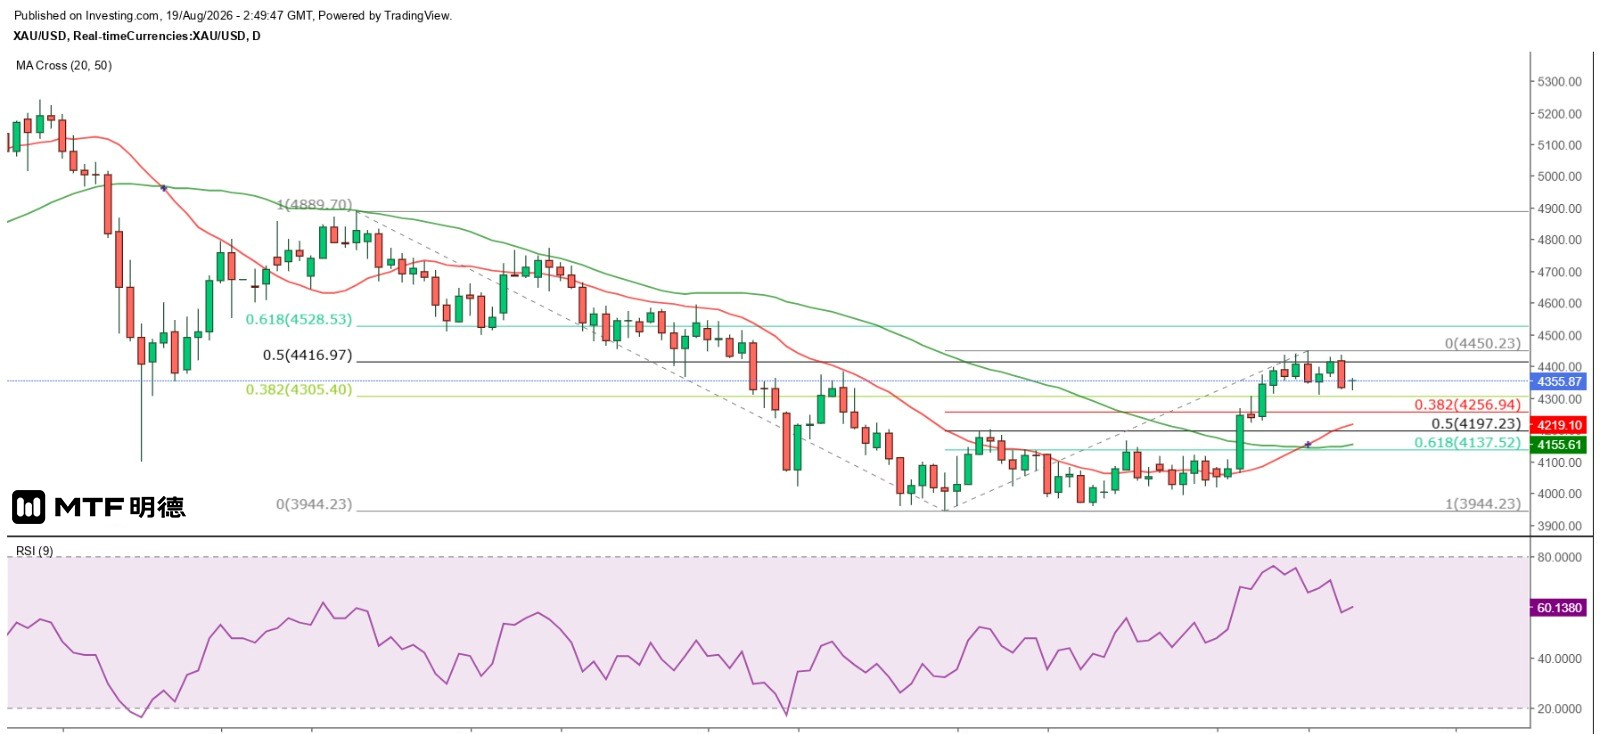
The gold price continues to adjust. Yesterday's volatility exceeded $103, yet it still closed down by over $83, marking the second time since August 13 that a "head-and-shoulders" pattern has formed on the daily chart—indicating strong selling pressure remains. On the daily chart, the 20-period SMA (4219) has further diverged upward from the 50-period SMA (4155), suggesting that the support level for any pullback is steadily rising. Based on gains since June 30, gold may stabilize at either the 38.2% retracement level (4256.62) or at the Gann Square 180-degree angle of $4,210 before launching a new upward wave.
In the short term, after touching a low of $4,324.3 in this morning’s Asian session, gold formed a bullish engulfing candlestick on the hourly chart, indicating some support around the Gann Square 225-degree angle at $4,310. Currently, prices have rebounded to near $4,360—the midpoint between the weak support at $4,310 and the strong resistance at $4,410. Whether gold can climb further depends on whether it breaks above the hourly 20-SMA at $4,368. Even then, a close above yesterday’s high of $4,436.39 would be required to signal a reversal of the downtrend.
On the hourly chart, gold remains range-bound with slightly narrowing volatility. The sharp rebound this morning from $4,324.3 was technically driven by the 9-RSI dropping as low as 12, signaling extreme oversold conditions; currently, the 9-RSI has risen to 47. Judging by short-term cyclical patterns, gold is likely to continue fluctuating downward before bottoming out this Friday, followed by a strong recovery. If the lows reach the daily 20-SMA or $4,210 at that point, the likelihood of an upward rally increases significantly.
The above information is for reference only and does not constitute investment advice.


