
 Whatsapp
 Telegram
 2026-08-17
 Gold prices are expected to initiate a new round of upward movement.
Gold Price Poised for a New Uptrend
Completed on 17/8/2026 at 11:00
U.S. retail sales unexpectedly declined in July, falling by 0.6% month-on-month—below the expected gain of 0.1% and June’s 0.2% increase—and marking the first drop since October 2025. Core retail sales also fell by 0.3% month-on-month, underperforming both the forecasted 0.2% rise and June’s 0.2% decline. Year-on-year growth slowed from 6.75% to 5.01%. The main driver behind the July decline was a 2.2% monthly drop in non-store sales, likely reflecting Amazon's shift of its member-exclusive discount day from July to June. Therefore, the unexpected fall in U.S. retail sales does not necessarily indicate a weakening market.
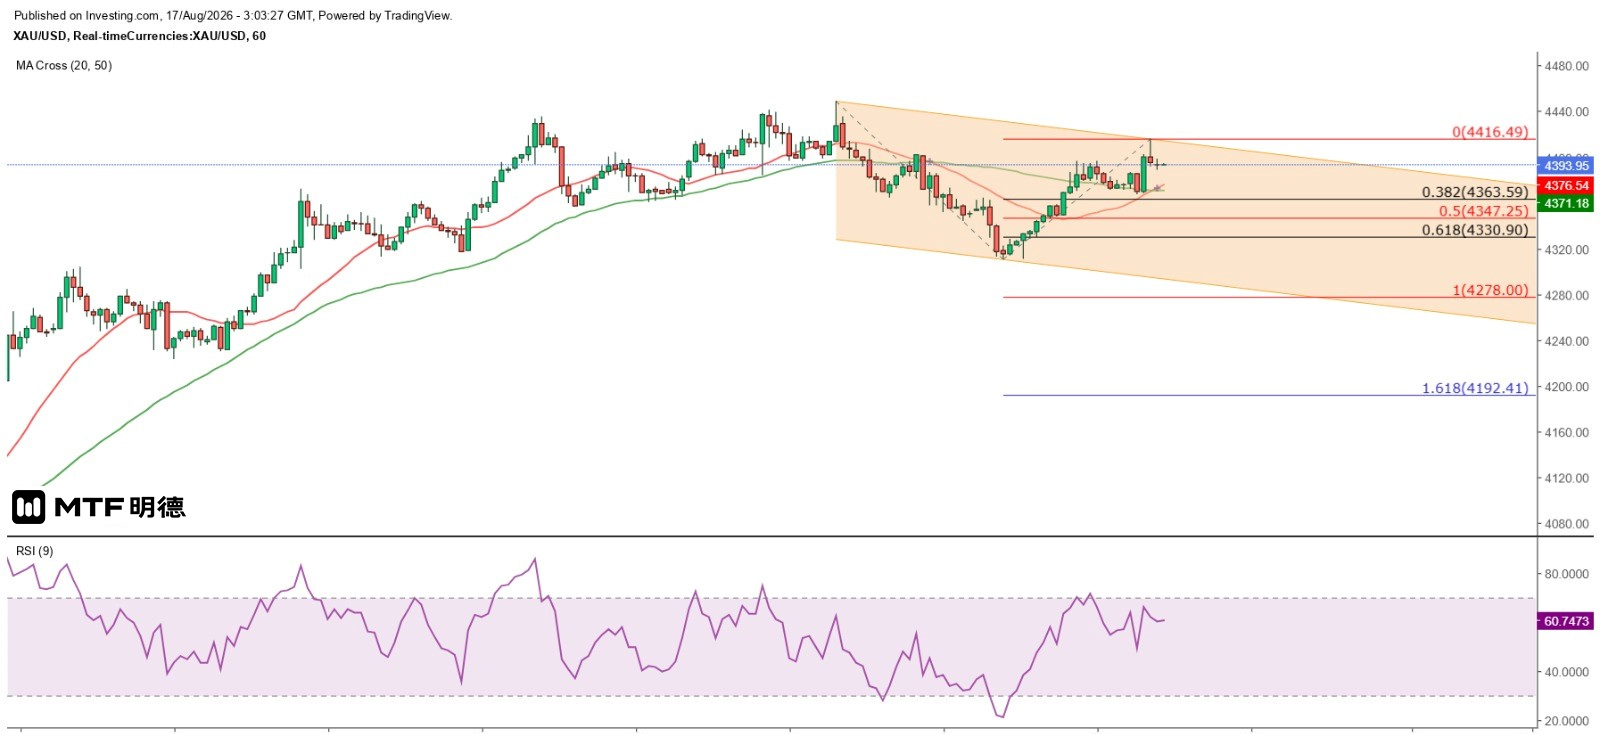
Speculators seized the opportunity, capitalizing on expectations of lower interest rates. Gold prices surged immediately after the retail data release, climbing to $4,386.91, then retraced to a low of $4,370.09 within the following half-hour before recovering sharply to reach a high of $4,396.88. Subsequently, prices pulled back again. At London’s close, gold peaked at $4,396.67 before forming a double top on the five-minute chart and declining. This morning, spot gold briefly hit $4,416.49 but later retreated below $4,400, indicating that the 50% retracement level of the largest decline since April 17—$4,416.97—remains a key resistance.
However, on the hourly chart, gold broke above the 50-period SMA (currently around $4,371.6) early Friday in New York trading and has clearly held above this line since. This morning, after briefly testing the 50SMA, it closed with a strong bullish candlestick, surpassing last Friday’s high. Meanwhile, the 20SMA is now beginning to cross above the 50SMA, suggesting that after consolidation, gold may retest the $4,416 resistance level today. Notably, if gold holds firmly above the Gann 270-degree vertical angle at $4,410, it would signal readiness for a new upward move, targeting $4,510 and $4,660. Thus, the 50SMA on the hourly chart and today’s bullish candle’s low at $4,368.32 should be viewed as critical support levels, implying a strong rebound if prices fall to those levels.
From a more conservative perspective, gold could potentially form a balanced descending channel on the hourly chart. If so, the key support would be the Fibonacci 100% extension target from August 13 at $4,278. However, any short position would require confirmation that gold closes significantly below $4,368.32 on the hourly chart without generating strong reversal signals such as a double K-line pattern.
The above information is for reference only and does not constitute investment advice.


