
 Whatsapp
 Telegram
 2026-07-22
 The gold price is expected to have formed an upward trend.
Gold Price Likely to Have Formed an Upward Trend
July 22, 2026, 9:22 AM
U.S. President Trump suggested that Iran may have transferred key components needed for nuclear weapons production to Qom, and indicated that the U.S. would soon launch a major strike on the region. In response to recent developments in U.S.-Iran relations, the foreign exchange market reacted sharply, with non-U.S. currencies continuing to decline. The euro fell back toward 1.14 against the dollar, while the pound dropped below 1.34 against the dollar, and the dollar surged to around 163 against the yen. Conversely, both oil and gold prices rose simultaneously—crude oil rebounded above $85, and spot gold prices jumped sharply in early Asian trading today, surpassing the $4,100 level.
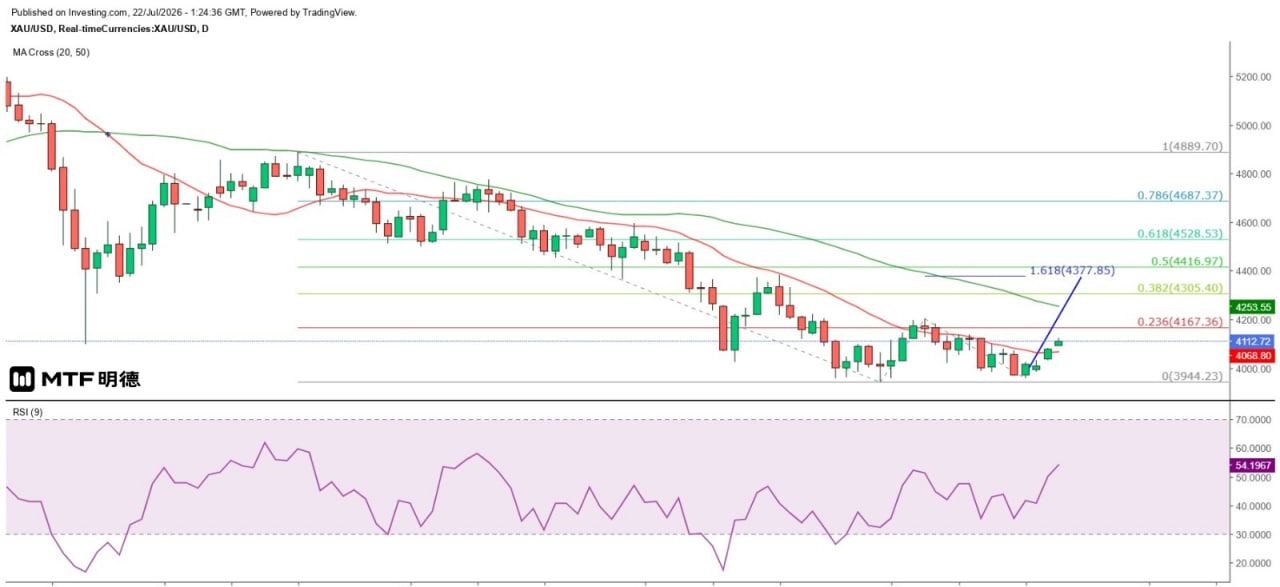
As seen on the daily chart, New York crude oil broke above the 50SMA (currently around 83.5) yesterday, with significant resistance expected near $88.26. Spot gold, as anticipated, successfully challenged $4,110, rising as high as $4,115.84. On the daily chart, gold also broke above the 20SMA (currently around $4,069) yesterday. Earlier it was noted that gold had been closely tracking the 20SMA downward recently, indicating its readiness for an upward breakout—exactly as expected.
The key issue currently is how oil and gold prices would react if the U.S. military launched a larger-scale attack on Iran. In theory, if the U.S. attacks Iran again, it could eventually reopen the Strait of Hormuz shipping lanes, leading to a drop in oil prices. Meanwhile, gold prices would likely continue rising due to persistently high global inflation rates. Ultimately, the outcome will depend on whether the Federal Reserve shifts toward a more hawkish monetary policy—should it tighten policy to combat inflation (via interest rate hikes), gold prices would face downward pressure.
As seen on the daily chart, gold has formed a higher bottom, signaling the end of the downtrend since mid-April this year. The market is now likely to move in a sideways-upward direction, with an upward trend already established. Gold is expected to further test the Gann 90-degree angle at $4,210, with the next target being the 50SMA (currently around $4,253). Ultimately, resistance may emerge only when prices reach $4,417, as $4,410 lies at the Gann 270-degree vertical angle.
The above information is for reference only and does not constitute investment advice.


