
 Whatsapp
 Telegram
 2026-05-28
 Gold price breaks through 4410 - be cautious of a single-day reversal
"Gold Price Breaks 4,410—Beware of a Single-Day Reversal"
Completed on May 28, 2026, at 11:00
As the U.S. and Iran reportedly neared a framework agreement, tensions flared again. Trump stated he was dissatisfied with the current deal, adding that even if Iran abandoned highly enriched uranium, it would not receive relief from U.S. sanctions. Commenting on reports about Iran and Oman jointly controlling the Strait of Hormuz, he said Oman would behave well and rejected any such mechanism, warning that otherwise the U.S. would have no choice but to bomb them. He emphasized that the Strait of Hormuz would remain open to all and under no single nation's control, regardless of any agreement reached with Iran. He noted that while the U.S. would oversee operations, no country would have direct control over the strait—an aspect he described as part of the negotiation process. Later, according to Iran’s Tasnim News Agency, citing a military source, U.S. forces opened fire in the Strait of Hormuz area after Iranian Revolutionary Guards confronted a U.S. oil tanker attempting to pass through the strait.
Gold and oil prices have moved in tandem this week. Crude oil has repeatedly fallen below $90, hitting a low of $89.94 this morning before stabilizing temporarily around the $90 level. However, it has already broken below the ascending trendline of a narrowing triangle on the daily chart, with a projected downside target at $80.6—very close to the April 17 low. Oil may find temporary support at that level, but by then the downtrend will likely be well established, and prices are expected to test the $70 level going forward.
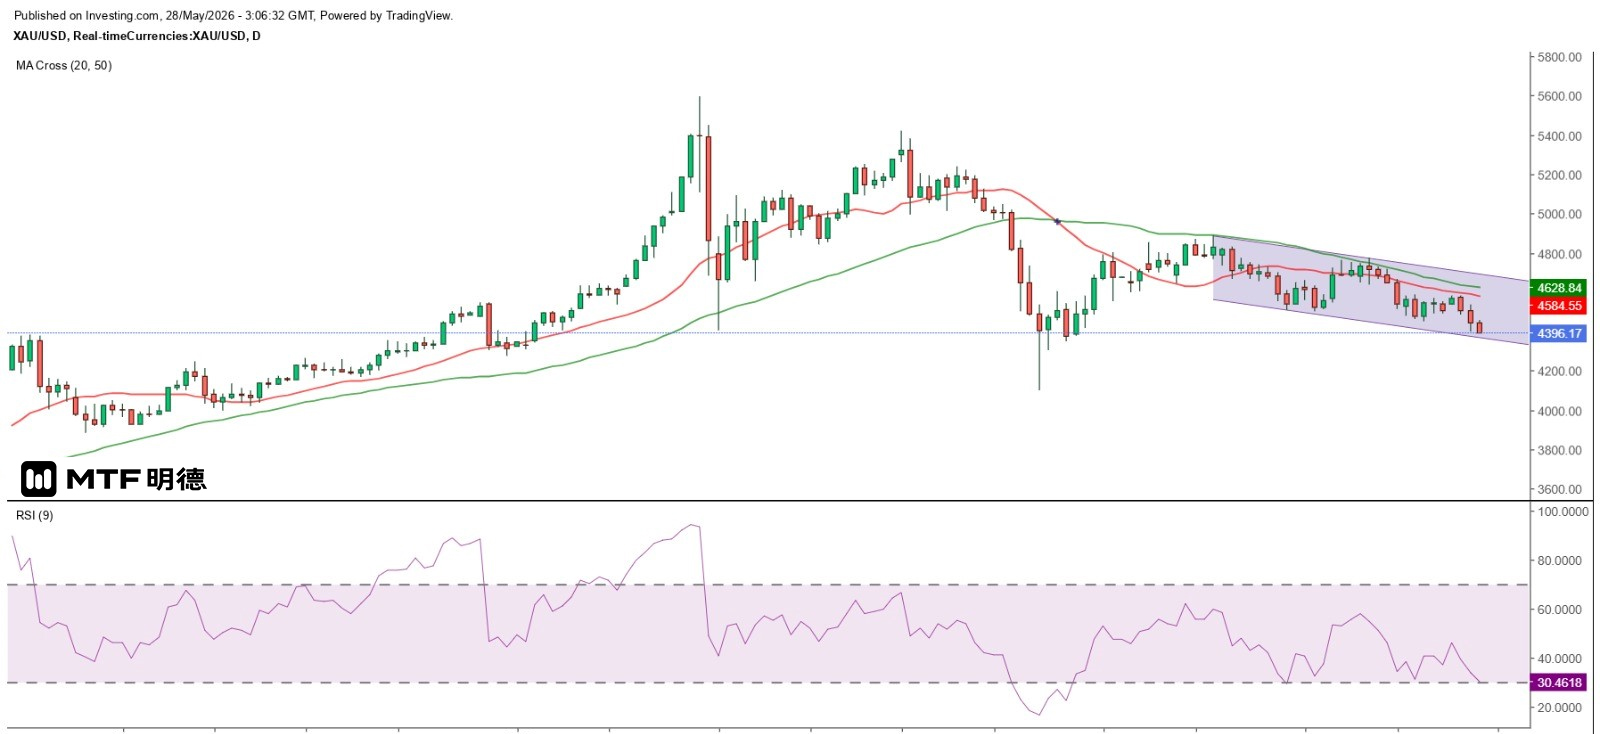
The spot gold price also broke below the support level of a descending triangle on the daily chart, and yesterday fell further to breach $4,500, intensifying the downward trend. It briefly dropped as low as $4,401.45, and continued declining this morning, reaching a temporary low of $4,393.44. On the daily chart, gold has formed a new descending channel pattern. From the Gann Square perspective, the price has now broken through the strong 270-degree angle support at $4,410. Investors should be cautious of a potential sharp rebound during the day, which could trigger a reversal pattern. If a strong reversal signal appears on the hourly chart, short positions should immediately take profits. It is expected that gold will likely retest the psychological resistance level of $4,500 in the near term.
The above information is for reference only and does not constitute investment advice.


