
 Whatsapp
 Telegram
 2022-06-16
 dot graphics
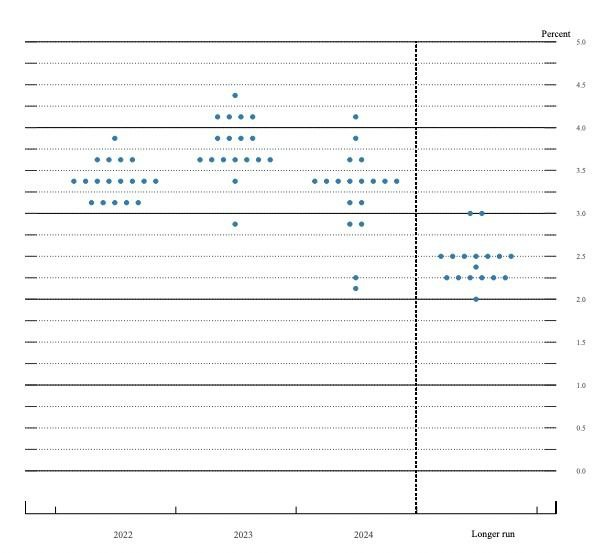
The Fed's latest dot plot shows that U.S. interest rates will continue to climb rapidly, peaking in 2023 and starting to cut in 2024 . What is a lattice diagram? The point solution will be opposite the breath point
Enlightening? DOT PLOT is actually a graphical record of the forecasts of the 18 FOMC members for future interest rates. In the figure, 0.25 per cent is used
Calibration . Members' average annual interest rate expectations are shown on the same chart in the form of scattered dots , with each point representing a member's interest rate expectations
To see the number of possible rate increases in each year . Although the dot plot does not give voting rights to all 18 members each year , the Fed rotates voting members each year because
This record of the intention of all members will also have implications for future information. However, the dot plot, like a dark vote, is not registered, so it also becomes a blind spot , the final result is possible
Different from the dot plot depending on voting intentions
Learn more every day,
Retail investors change experts


