
 Whatsapp
 Telegram
 2026-10-30
Gold prices will only rebound when they fall to $3810.
Gold Market Analysis: "Gold Price Needs to Fall to $3,810 Before a Rebound is Likely"
October 30, 2026, 9:46 AM (Completed)
Yesterday, the U.S. released its preliminary estimate of third-quarter GDP, showing an annualized quarterly growth rate of 3.4%, exceeding expectations of 3.2% and surpassing the 2.2% recorded in the second quarter—marking the largest increase since the fourth quarter of last year. Private consumption expenditures (PCE) contributed 2.52 percentage points to GDP growth, the highest contribution since the first quarter of last year, while private domestic investment added another 2.73 percentage points. Although net exports continued to drag down GDP by 3.32 percentage points, overall data still supported accelerated economic expansion. Additionally, the year-on-year rise in total PCE for September widened to 3.6%, while core PCE increased by 3.1% year-on-year. These figures support further Federal Reserve interest rate hikes, putting downward pressure on gold prices.
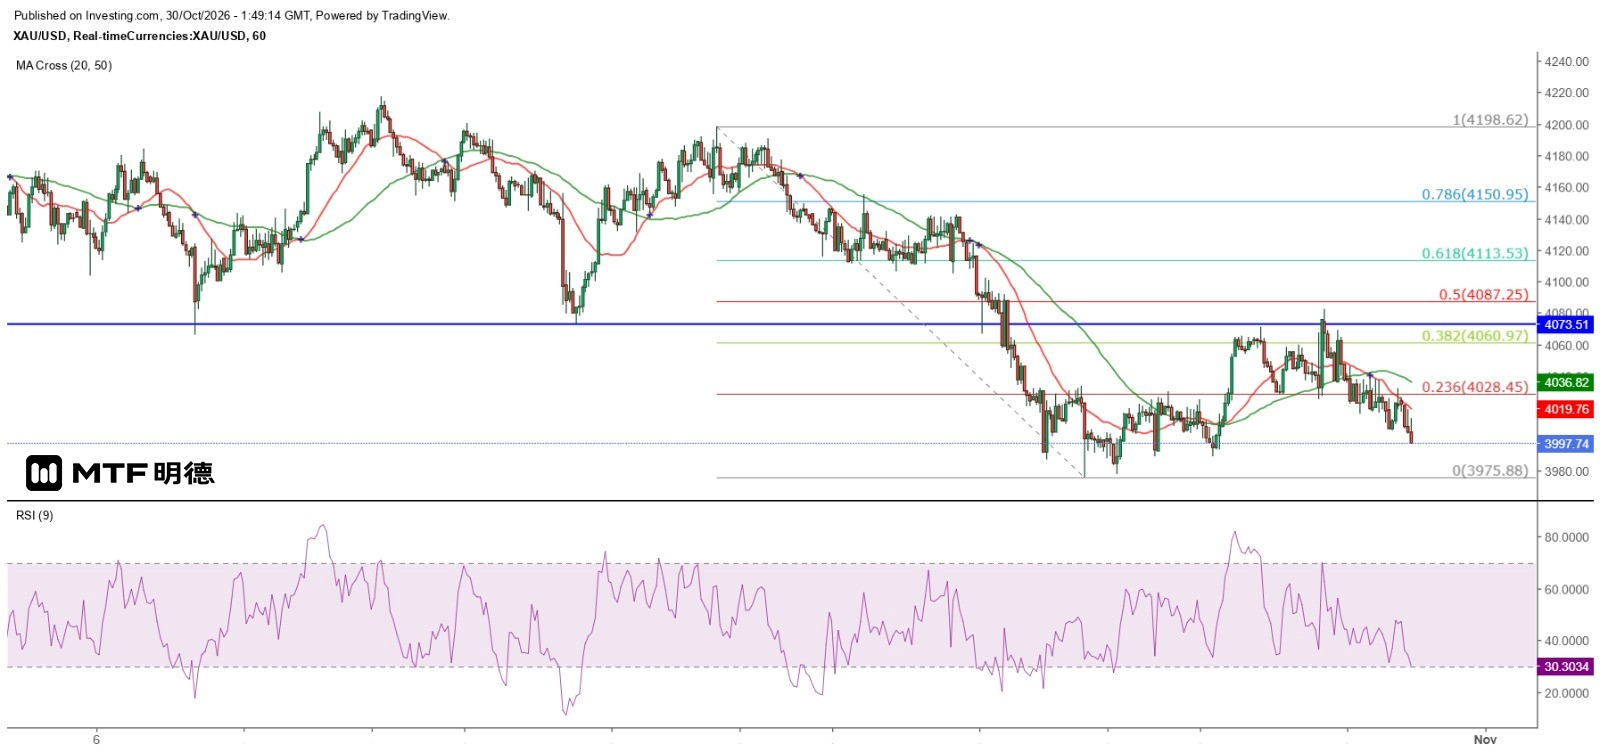
In early trading in Tokyo today, gold briefly rebounded to $4,018.84 but quickly reversed course, falling as expected below the $4,000 level. The previous high from yesterday's rally was capped by the lower boundary of a prior sideways range, indicating that gold has entered a lower-tier volatility zone. Moreover, the $4,010 level lies along Gann’s 90-degree angle, forming a strong support (or resistance) point. If this level is confirmed broken, gold is likely to test $3,910 in the short term for initial support. However, this level is not robust; a stronger rebound may only emerge when prices approach $3,810.
On the hourly chart, after breaking below the 20-period SMA (currently around $4,020) on Wednesday, gold has continued declining along this moving average, repeatedly failing to sustain gains upon testing it. Technically, gold faces three key resistance levels in the near term: $4,010, the 20-hour SMA, and the 50% retracement level of the largest decline since October 16 at $4,087.25. Traders anticipating a short-term bounce should watch the 20-hour SMA closely—only if gold breaks above and holds above this line can it potentially challenge higher levels. Conversely, the 20-hour SMA could also serve as an ideal short-term selling point.
The above information is for reference purposes only and does not constitute investment advice.


