
 Whatsapp
 Telegram
 2026-09-15
 Gold prices are expected to fluctuate above the 50-day moving average in the short term.
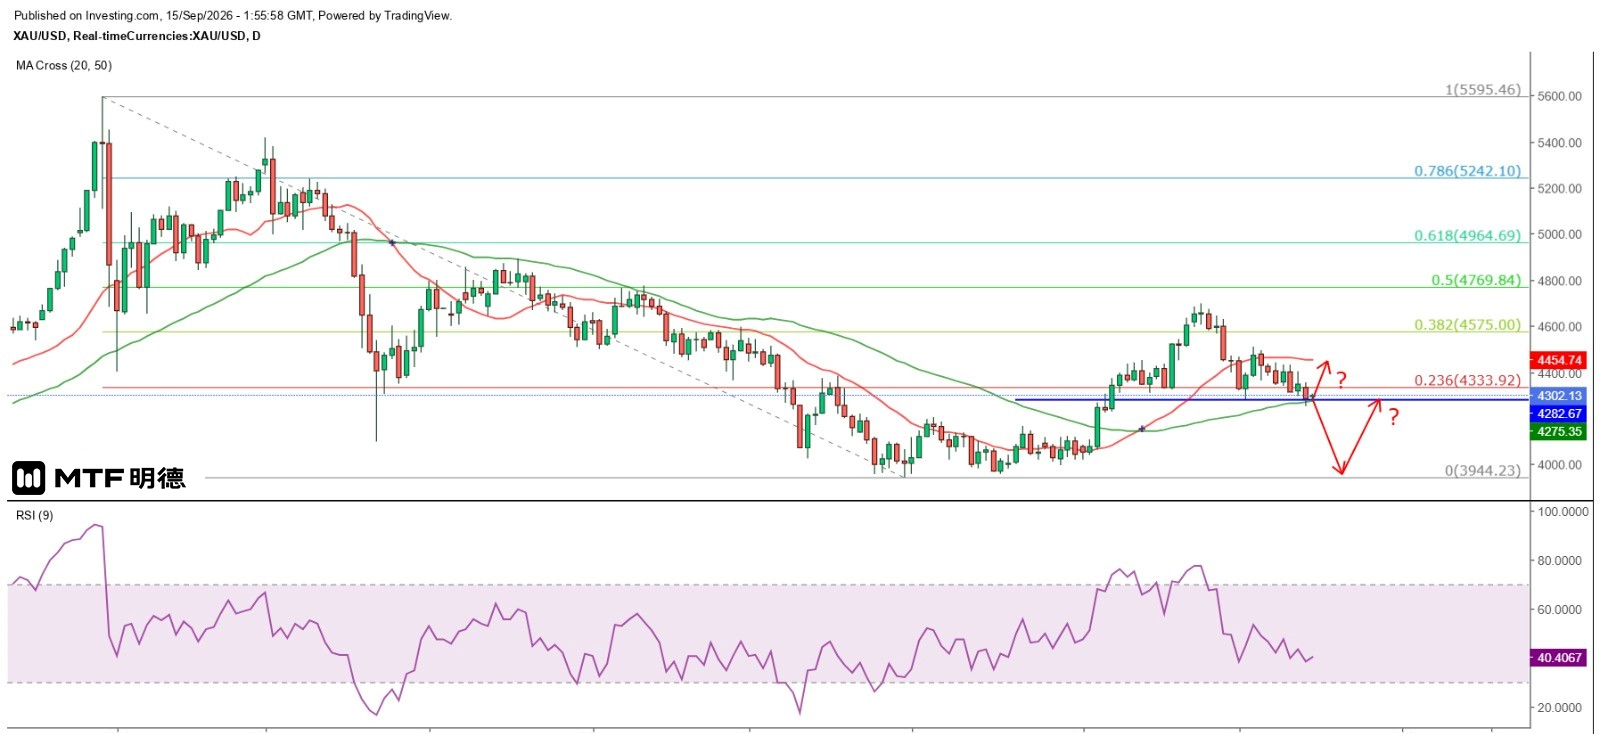
"Gold Price Expected to Fluctuate Above 50-Day Moving Average in the Short Term" – Completed on 15/9/2026 at 9:53
Ahead of the Federal Reserve's interest rate decision, gold prices continued to face pressure. Although spot gold rebounded early in Asian trading to around $4,355, it quickly encountered strong selling pressure and resumed its downward trend into the early New York session. The price sequentially lost key levels at $4,310 and $4,300, falling as low as $4,253.82 before launching a recovery wave. After London market close, gold briefly rose to $4,317.88 but then declined again, ultimately breaking below $4,300 by the end of the New York session.
However, after today’s Asian open, gold regained above $4,300. Although it later dipped again, the lows did not fall below yesterday’s closing level in New York. On the 5-minute chart, gold formed a double bottom at $4,282 and $4,283. Although gold did not reach the Gann 180-degree angle at $4,210 yesterday, the daily decline was nearly $100, suggesting that the impact of this week’s Fed rate hike has already been fully priced in. If the Fed raises rates by 25 basis points at this meeting but signals caution in its post-meeting statement—such as indicating further hikes depend on ongoing developments, particularly the Middle East situation’s impact on oil prices—the likelihood of another rate increase in October remains low. Especially since the meeting occurs just one week ahead of the U.S. midterm elections, it is even less likely that the Fed would adjust rates during such a sensitive period.
For the Fed to monitor the Middle East situation, key considerations include the outcome of the mid-term elections and Trump’s subsequent policy toward the region. $4,210 remains a strong support level for gold. Even if the Fed does raise rates, provided it maintains a cautious stance as expected, the chances of gold breaking below this level are slim, as investors always look forward. On the daily chart, gold briefly fell below the head-and-shoulders neckline at $4,282.71 and the 50-day SMA (currently around $4,275), but eventually closed back above the neckline.
On an optimistic note, following the Fed’s rate decision, gold could trade within a range between the 50-day and 20-day SMAs (currently around $4,454). A more pessimistic view suggests that if the Fed announces a rate hike and gold breaks below the 50-day SMA, there is a high probability of forming a major double bottom near $4,000 or testing that level with a divergence against the RSI, followed by a strong rebound. However, it is unlikely that gold will break above the August 25 high of $4,697.66 in the fourth quarter.
The above information is for reference only and does not constitute investment advice.


