
 Whatsapp
 Telegram
 2026-09-01
 Gold price fluctuation narrows, awaiting breakthrough.
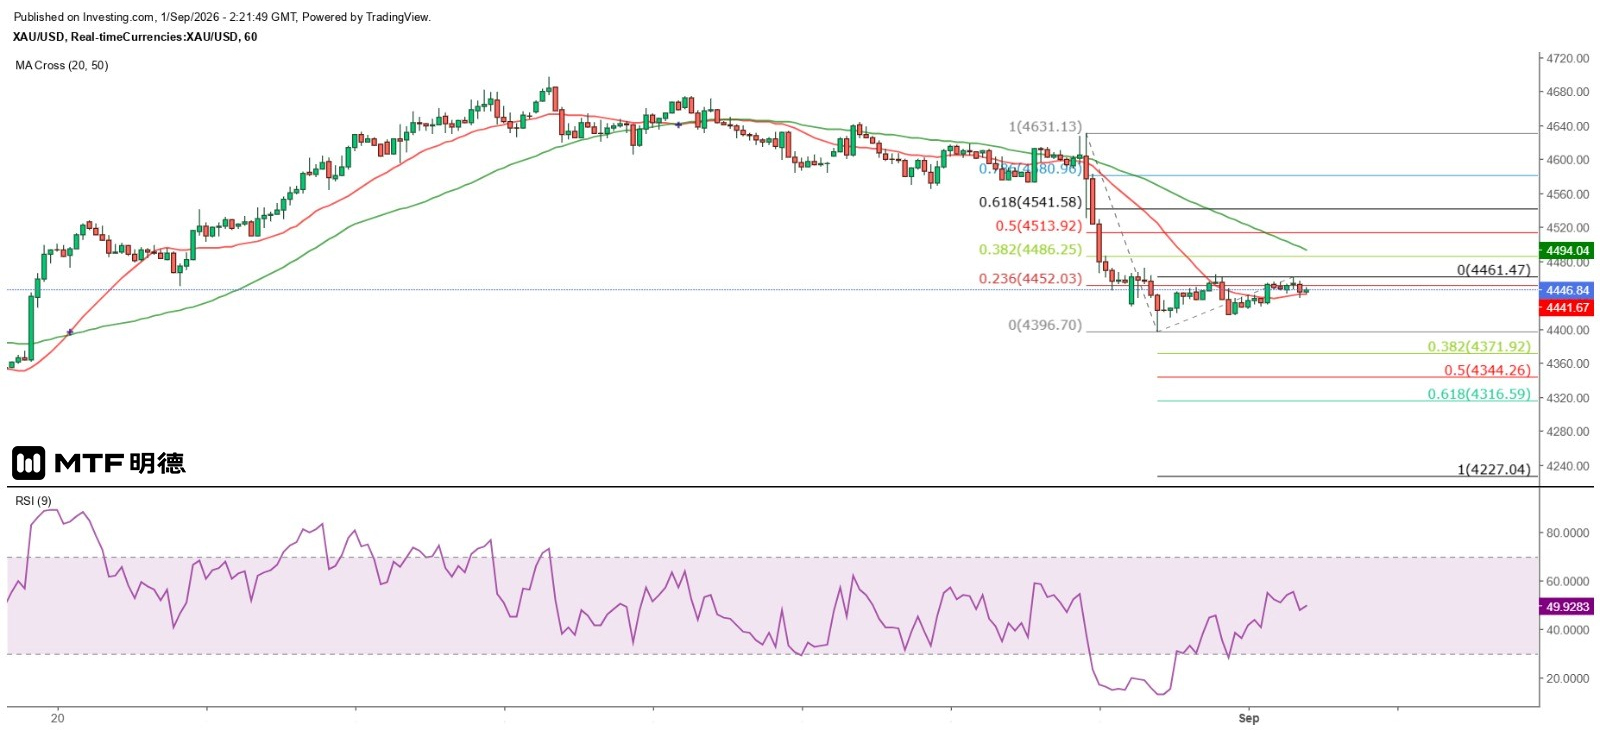
"Gold Volatility Narrows, Awaiting Breakout" – Completed on 1/9/2026 at 10:20
Yesterday's gold price showed unusually calm movement. Spot gold initially surged to $4,464.07 during early Asian trading, then quickly reversed, dipping as low as $4,415.74 before beginning a rebound. However, the day’s high and low were effectively established within this two-and-a-half-hour window. Gold failed to break out of this less-than-$49 range during both European and New York sessions. Markets appear temporarily confident in the Federal Reserve’s resolve under Powell to combat inflation, yet this contrasts sharply with the weak labor market. Gold briefly tested below the 20-period SMA on the daily chart ($4,447), suggesting that traders are awaiting a clearer breakout signal.
On the same timeframe, my personal preference—or perhaps habit—is not to chase sell opportunities when prices reach major moving averages, nor do I buy aggressively upon reaching them; instead, I wait for new breakout signals from the market before acting. Currently, gold is hovering near the 20-period SMA on the daily chart, so if you're considering selling, it would be wise to look for confirmation from other timeframes. For example, on the hourly chart, the downtrend appears more evident—though stop-loss levels should also be determined based on this shorter-term view.
Looking at the hourly chart, the first noticeable pattern is a descending flag formation. The rebound from yesterday’s low reached only about 23.6% of Friday’s New York high-to-low decline, placing the current level around $4,460, indicating relatively weak momentum. Measured by a 1:1 Fibonacci extension, gold could potentially fall further to $4,227. If a true downward breakout occurs, which price levels might offer significant support before reaching $4,227?
From a Gann Square perspective, $4,310 lies along the 225-degree angle, representing weak support (or weak resistance). $4,210 sits at the 180-degree angle, marking strong support (or strong resistance). The projected downside target of $4,227 is close to this strong support zone at $4,210, suggesting that a bounce may be imminent once gold approaches $4,227. Meanwhile, $4,316.59 corresponds to the 61.8% Fibonacci extension, while $4,344.26 marks the 50% extension level. Therefore, the area between $4,344 and $4,316 could represent the first key support zone. Should gold break above $4,460, resistance is expected at $4,510—the Gann 315-degree angle.
The above analysis is for informational purposes only and does not constitute investment advice.


