


 Whatsapp
 Telegram
Gold prices have experienced another short-term fluctuation and decline.
"Gold Price Fluctuates Again in the Short Term" 11/5/2026 10:54 Completed
Rather than saying that the US-Iran negotiations have "once again" reached a deadlock, it would be more accurate to say that there has never been any breakthrough in the talks! The positions of both sides are quite clear. The US does not allow Iran to possess nuclear weapons and demands that all highly enriched uranium be transported out of the country. Iran, on the other hand, insists that the strait blockade and long-term sanctions be lifted first, and that compensation be made for the losses caused by the war. It is evident that both sides are holding their ground, resulting in no progress in the negotiations. As a result, oil and gold prices have been fluctuating.
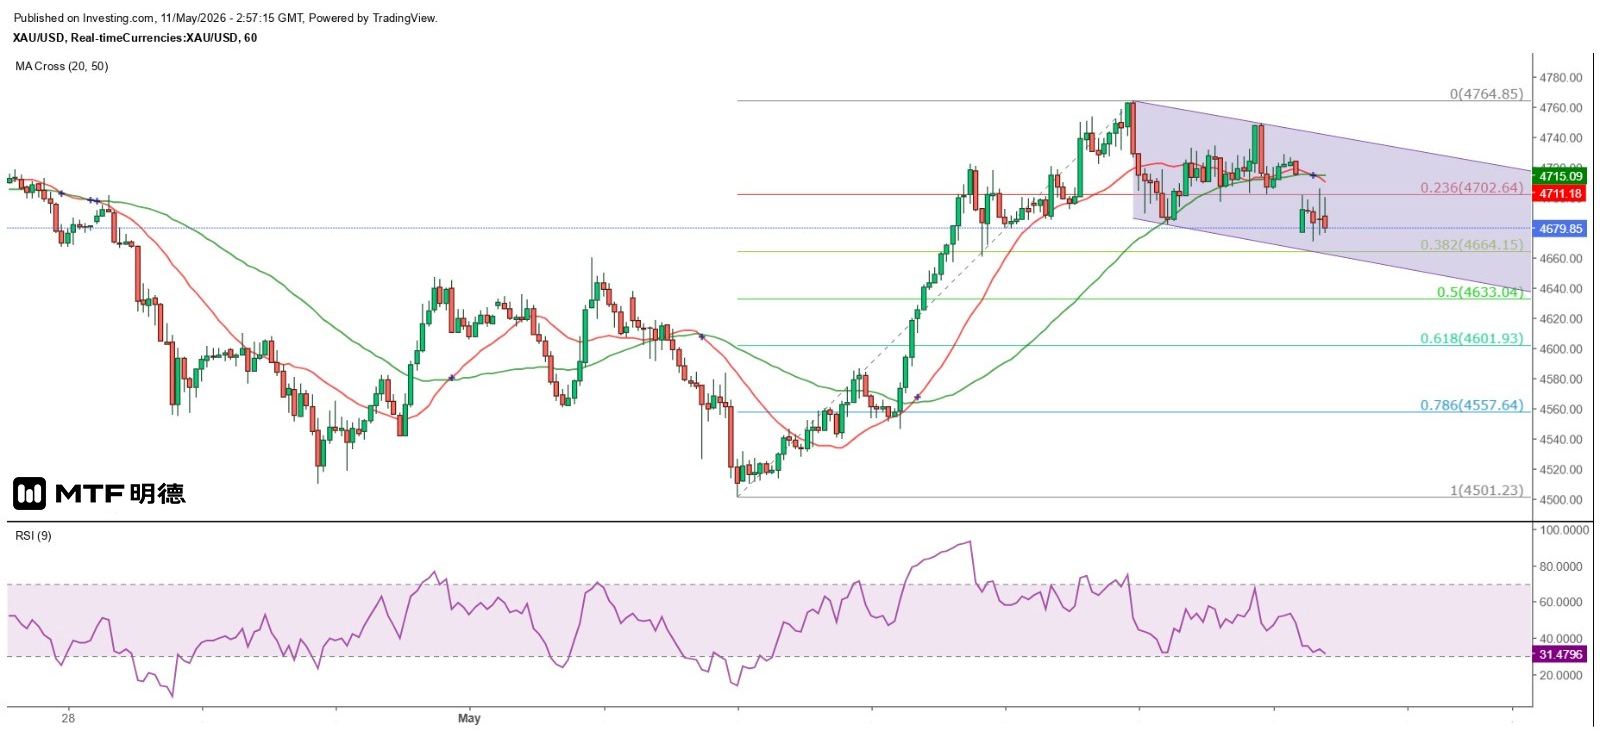
Gold prices, as expected, failed to break through the previous high of $4,764.85 after rebounding last Friday. The highest point reached was $4,749.42, and a bearish engulfing pattern emerged on the hourly chart. This morning, it gapped lower at the opening. Although it temporarily stabilized after hitting a low of $4,670.6, it still failed to fill the downward gap. Moreover, the hourly chart shows a pattern of each wave being lower than the previous one. For now, around $4,710 seems to be the intraday resistance level, making a short-term test of $4,660 or even a break below that level highly likely.
From the hourly chart, the Gann level of $4,660 remains a key support (or resistance). Gold rebounded to $4,660.15 on May 1 but was then blocked and fell to $4,501.23 on May 1. After that, a strong rebound wave began. On May 6, it broke through this level in the Tokyo midday session and then retraced to $4,660.75 in the early New York session before climbing again. It finally reached a high of $4,764.85 on May 7 before falling again. Based on this, if gold breaks below $4,660 again, a pessimistic estimate is that it will test the $4,500 support level once more. In the meantime, the 50% and 61.8% retracement levels of the maximum increase during the above-mentioned period will be the targets, that is, $4,633.04 and $4,601.93 will be the short-term test levels. Moreover, the 50SMA on the daily chart ($4,755) is a major medium-term resistance for gold.
The above content is for reference only and does not constitute investment advice.
Previous Article Next Article


