
 Whatsapp
 Telegram
Gold prices are expected to initiate a rebound trend this week.
Gold prices are expected to stage a rebound this week. 18/5/2026 10:57 Completed
The situation between the US and Iran may heat up again, and global inflation is also rising due to a sharp drop in crude oil supply. The US inflation rate rose to 3.8% in April, the eurozone's inflation rate reached 3% in April, the UK's inflation rate was 3.3% in March, and Australia's inflation rate was even higher at 4.6% in March. Canada's inflation rate also rose by 0.6 percentage points to 2.4% in March. The market is concerned that the US-Iran deadlock will continue indefinitely, which will further worsen inflation. Interest rates not only have no chance of being cut but may even rise. Therefore, the US dollar has strengthened rapidly against major non-US currencies, and the performance of oil prices and gold prices continues to show an inverse relationship.
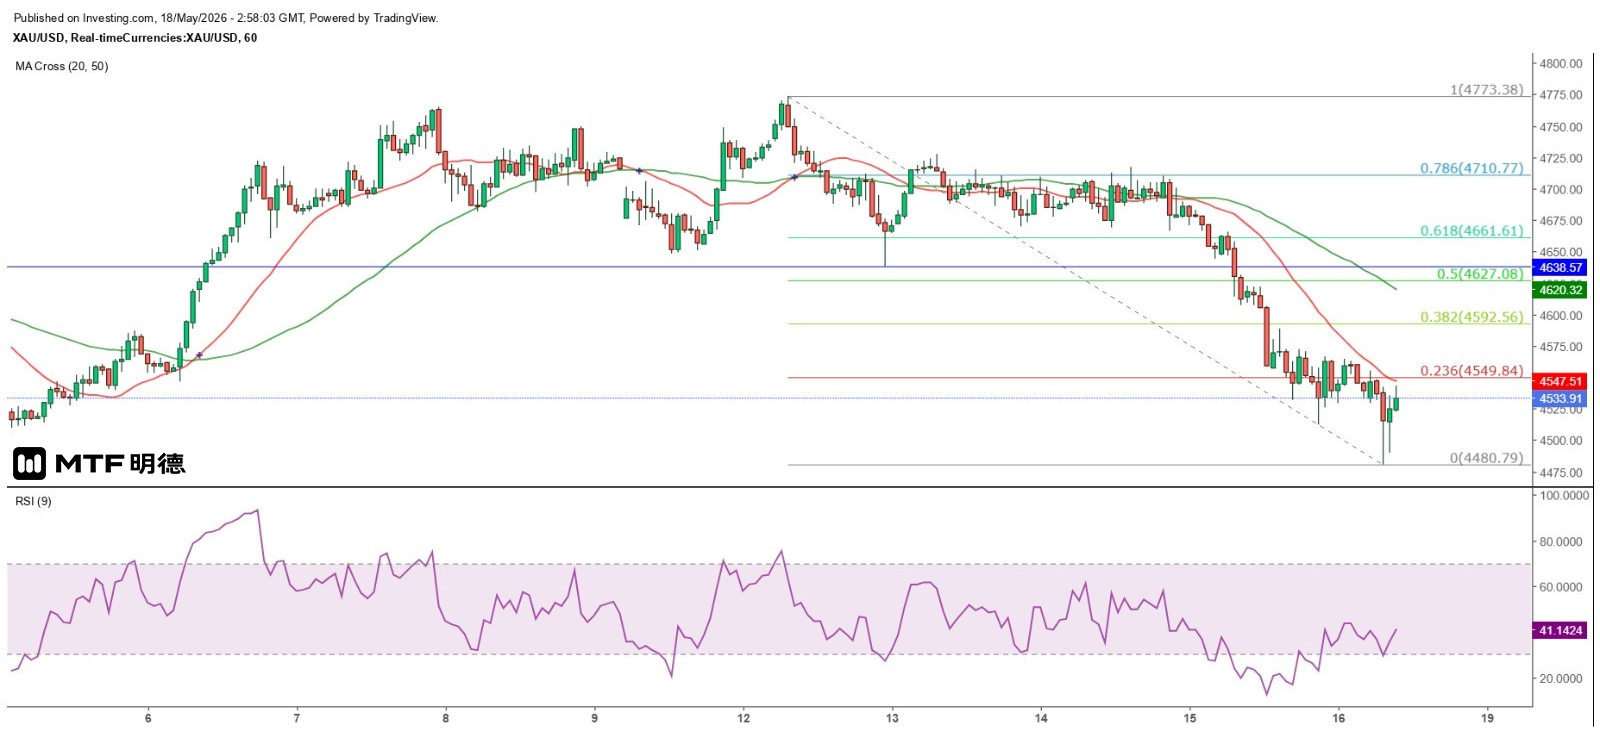
Last week, the performance of gold prices was disappointing. Spot gold prices continued to fall on Friday last week and even dropped below $4,500 in the early Asian market today, reaching a low of $4,480.79 before rebounding significantly and stabilizing above $4,500 for the time being. From the hourly chart, it can be seen that the gold price and the 9RSI have clearly shown a divergence at the bottom after being severely oversold. From a pattern perspective, the gold price broke through the bottom of the horizontal range on Thursday last week and fell further this morning, with the cumulative decline meeting the simple measurement of the decline target ($4,503.76).
Based on the short-term cyclical trend, gold prices bottomed out today in the short term. Coupled with the above technical factors, there is reason to believe that gold prices will rebound this week. If gold prices test $4,480 again on the hourly chart and find support, or a clear double bottom pattern is formed, the possibility of a sustained short-term rebound is very high. However, the first resistance is the bottom of the previous horizontal range on the hourly chart at $4,638.57, and the next important resistance is at $4,660. From the daily chart perspective, $4,500 can be regarded as the neckline of the double top, and it is expected to hold above it in the short term. The 50-day SMA ($4,707) remains the biggest resistance for the rebound. Only by breaking through and holding above $4,773.83 can the downward trend be considered broken, preparing for further gains in gold prices.
The above content is for reference only and does not constitute investment advice.


