
 Whatsapp
 Telegram
Gold price holds above 4600 and shows a strong rebound wave.
"Gold Price Holds Steady at 4600, Initiating a Strong Rebound Wave" 15/5/2026 11:07 Completed
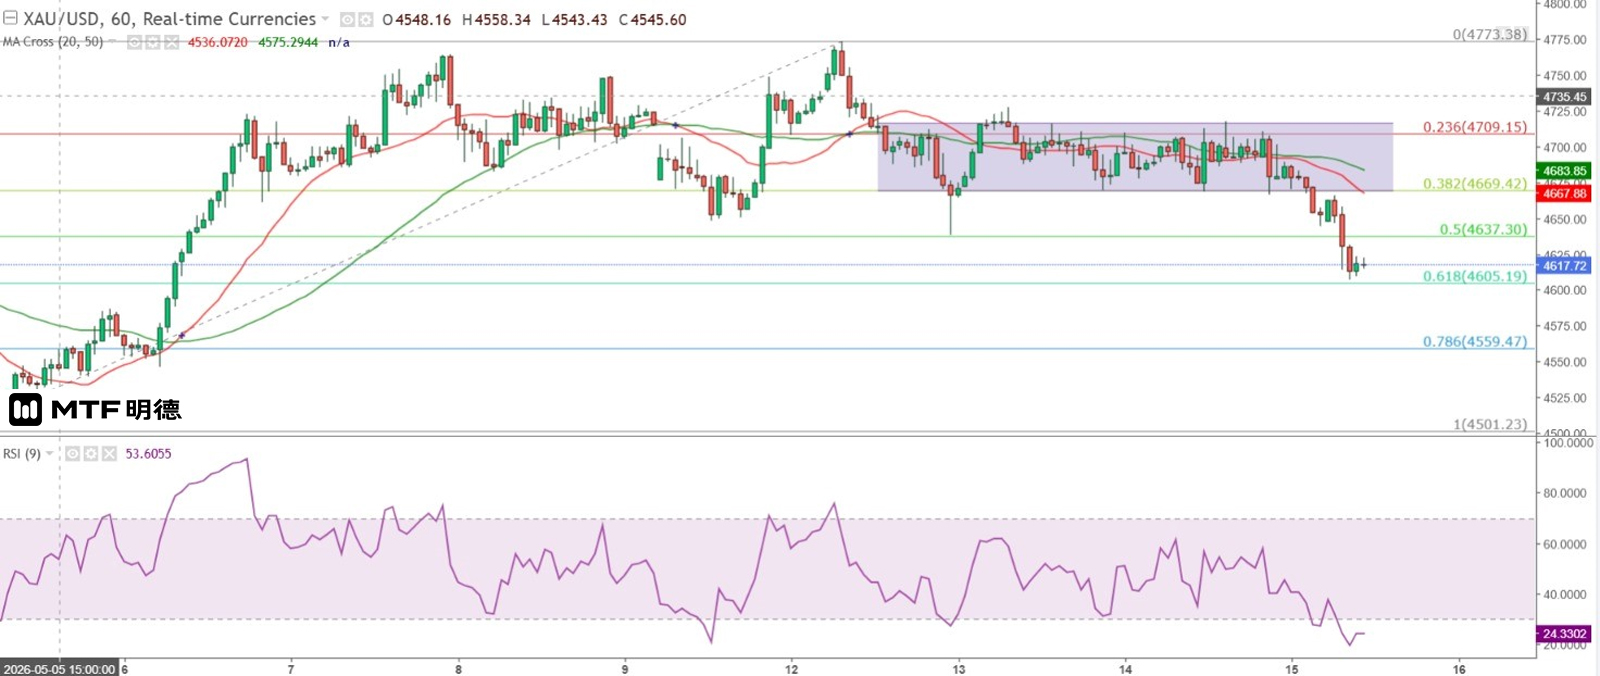
Yesterday, the gold price broke through the horizontal zone and the TD ascending trend line on the hourly chart and then declined repeatedly. In the early Asian market today, it reached a low of $4,607.26, slightly below the TD line's measured decline target of $4,612. Subsequently, the gold price stabilized slightly and formed a narrowing triangle on the 1-minute chart, but a flat-bottomed descending triangle on the 5-minute chart. It then gradually broke above the 20SMA (4,675), and the 9RSI on the hourly chart also dropped below 20, indicating that the gold price is about to launch a short-term rebound wave.
Although the situation between the United States and Iran remains tense and crude oil supply is still affected to some extent, the Islamic Revolutionary Guard Corps stated that 30 ships have been allowed to pass through the Strait of Hormuz since Wednesday of this week. On the other hand, data shows that Saudi Arabia's daily crude oil production increased to about 10.882 million barrels in February, and its export volume rose from 6.993 million barrels in January to 7.276 million barrels. Moreover, it plans to continue increasing production in April and aims to raise output to between 12 and 13 million barrels per day by next year.
The United States has become the world's largest oil producer this year. Its daily output in May was between 13.5 million and 13.6 million barrels, setting a new record high. As for Iran, it is reported that its oil storage facilities have been exhausted and it will be forced to halt production. Therefore, Iran will eventually have to reach a nuclear deal with the United States; otherwise, its economy will be severely damaged, threatening the ruling position of the Islamic regime!
Gold prices are expected to find support at $4,600 in the short term. From the hourly chart, the cumulative adjustment of gold prices is extremely close to 61.8% of the maximum increase from May 5th to 12th. Coupled with severe overselling, a strong rebound wave is expected. The first resistance level is the 50SMA on the 5-minute chart ($4,630), followed by $4,660. The range of $4,670 to $4,715 will become a higher-level resistance zone.
The above content is for reference only and does not constitute investment advice.


