


 Whatsapp
 Telegram
Gold price stays at $4700 and continues to attempt to reach new highs.
"Gold Price Holds at $4,700, Continues to Test Higher Levels" 7/5/2026 10:53 Finalized
The market is increasingly optimistic about the possibility of the US and Iran reaching a so-called "final agreement", causing oil prices to continue to fall while gold prices have further rebounded. According to CNN, citing sources, Iran is expected to submit its response to the US' proposed final agreement to mediators today, and it is said that both sides are making efforts to reach an agreement.
In fact, when investors conduct analysis, the ultimate outcome of some extreme situations is like the line in Jacky Cheung's song "Interlude of Life" - "From the beginning it has ended." The ultimate outcome of the war between the US and Iran is either the fall of the Islamic theocracy or reaching an agreement with the US. The result of the sharp rise in oil prices due to the war is bound to return to its original state! If you know from the very beginning that the upward trend of oil prices cannot be sustained, the direction of operation is already very clear. The key lies in risk management.
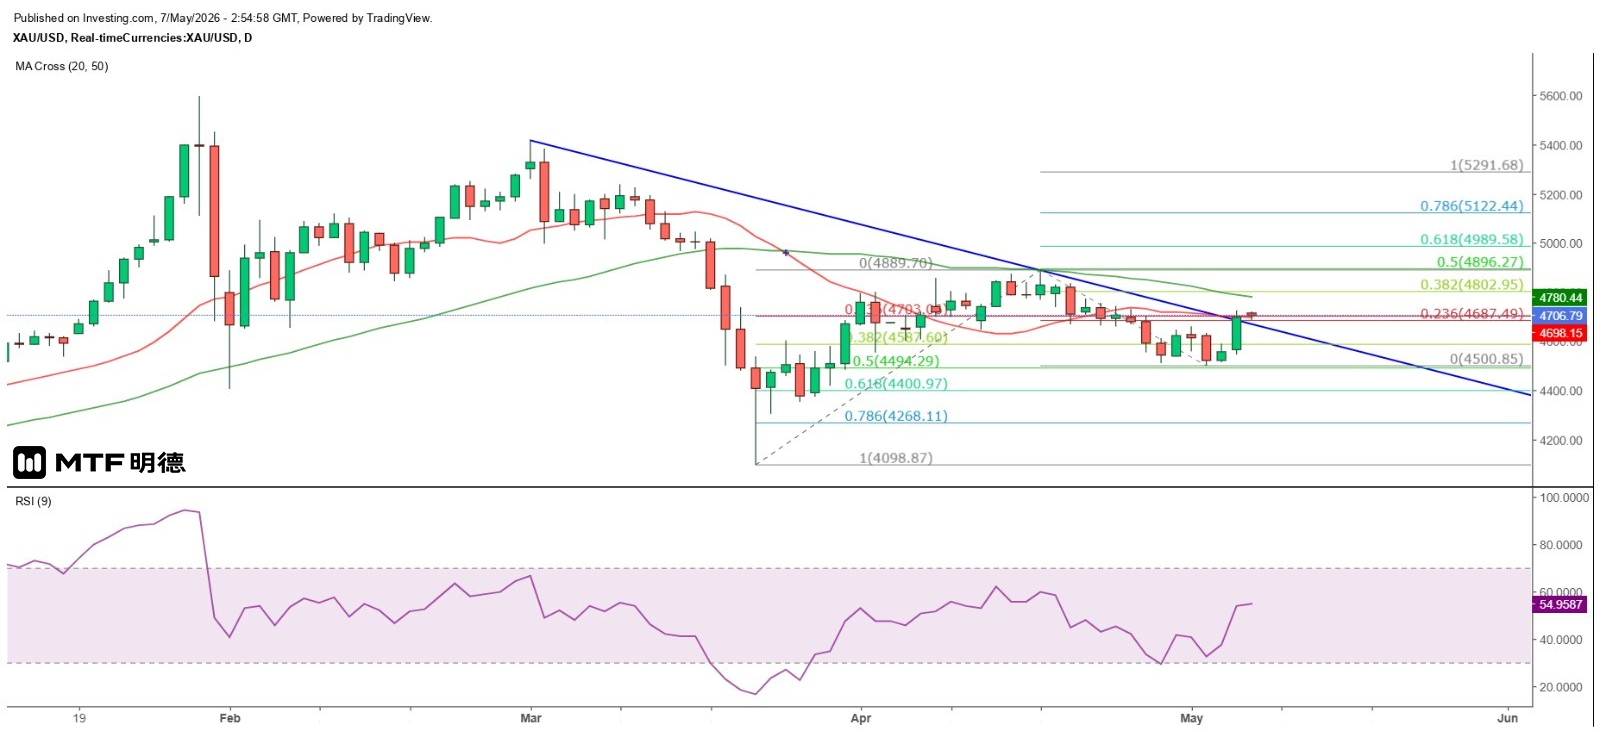
Spot gold prices rose by more than 166 dollars yesterday, not only breaking through 4700 dollars but also surpassing the resistance of the daily chart's downtrend line. Currently, it is consolidating above the 20SMA (4697.8) on the daily chart. From the perspective of Gann's Square, it is estimated that 4660 dollars will again become a strong support level. Therefore, the market is likely to fluctuate above 4660 dollars in the future. In the short term, it is expected to further challenge the 50SMA (4780), and 4810 dollars is expected to be the next resistance level to be challenged. Theoretically, 4700 dollars will become an important support level for the day.
Although silver has been neglected recently, its price still rose by as much as 5 dollars yesterday. From the daily chart, the price of silver has approached the lower trend line. Even though it has now broken through the lower trend line, it is highly likely to be a false breakout. There is a greater chance of a pullback, and for the time being, 70.85 dollars is seen as support. As for oil prices, they are in a triangular formation on the daily chart. It is expected that 80 dollars will be tested again, and this level can be regarded as a key support. If it is breached, 70 dollars will also be hard to hold back the decline in oil prices. I still believe that oil prices will have to fall back to 65 dollars to find support.
The above content is for reference only and does not constitute investment advice.
Previous Article Next Article


