
 Whatsapp
 Telegram
 2026-07-07
 Be cautious of a single-day reversal signal in the gold price.
Gold Price Cautions Against Single-Day Reversal Signal
Completed on 7/7/2026 at 10:50
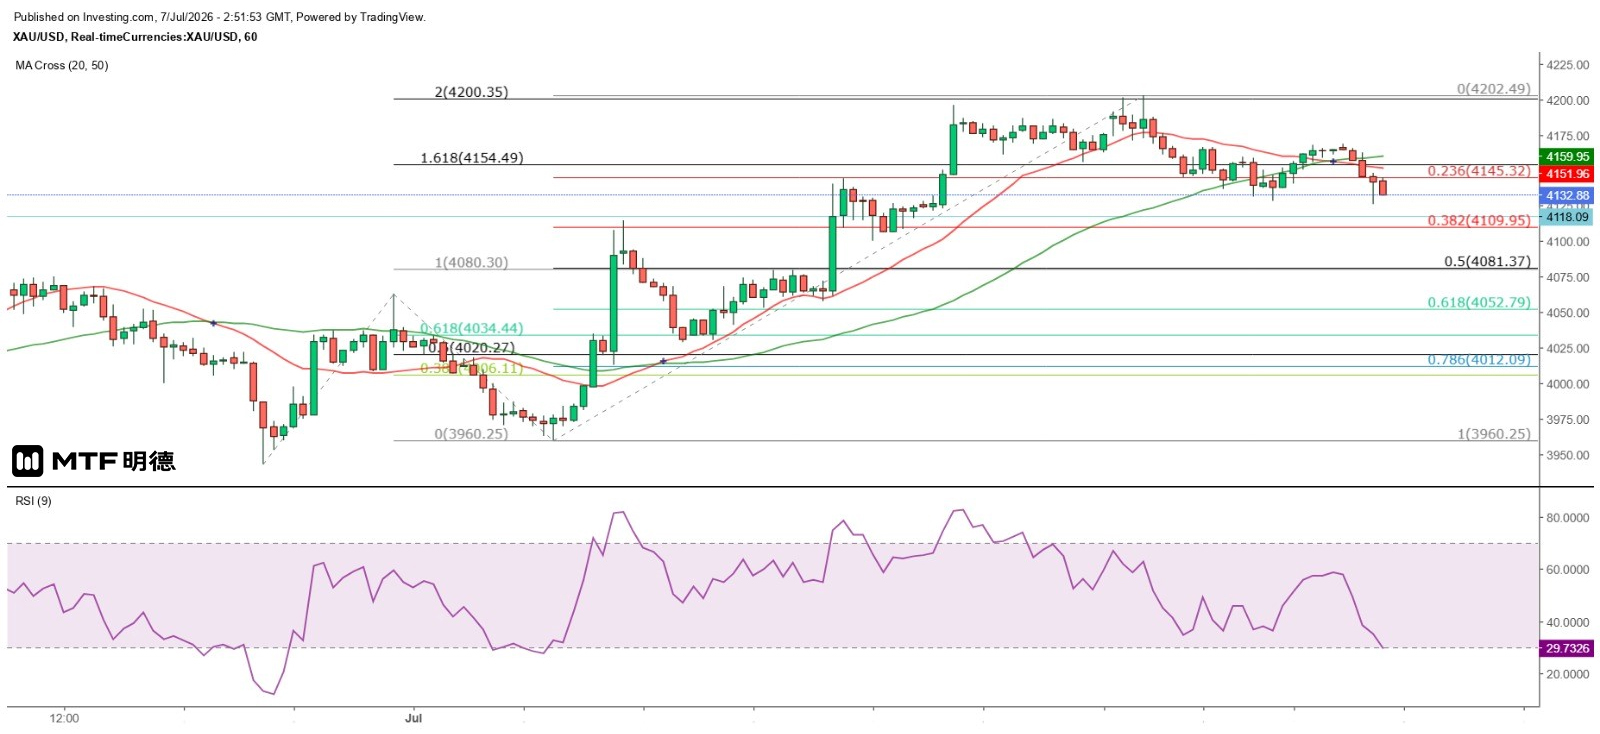
As expected, gold prices continued to decline. After rising twice above $4,200 yesterday, the spot price failed to sustain momentum and subsequently fluctuated lower. It dipped as low as $4,128.55 in early New York trading before rebounding to a high of $4,163.75 by the session's close. However, after Asian markets opened today, prices fell again, with the current low reaching $4,126.30.
On the hourly chart, gold prices have been gradually forming a lower-wave pattern since yesterday, having already broken below both the 50SMA (4160) and the 20SMA (4152). In the short term, $4081 serves as a key support level. However, calculating a 38.2% retracement of the largest gain since July 1st, prices could fall to $4109.95—very close to the secondary support at the 135-degree angle of Gann's square at $4110. Optimistically, gold may hold above $4110 before launching a rebound. Nevertheless, it is expected to remain capped by $4210, meaning that after any rally, a double top would likely form on the hourly chart, leading to another decline. In other words, the current low being tested will become the neckline support.
However, the daily chart tells a different story. Although gold closed with a bearish candle yesterday, it managed to hold above the 20SMA (4142.6) and is currently consolidating near that level again. The overall pattern appears to be forming an ascending flag, suggesting a strong reversal signal could emerge within a single day. If this happens and prices break above yesterday's high of $4202.67, the chances of gold advancing further toward the 50SMA (4383) and the strong resistance at the Gann square 90-degree angle at $4410 would significantly increase.
The above content is for reference only and does not constitute investment advice.


