


 Whatsapp
 Telegram
Gold prices are continuing to challenge their previous highs in the short term.
"Gold Price Continues to Test Highs in the Short Term" 6/5/2026 10:59 Completed
Trump's policy towards Iran has been inconsistent, causing continuous fluctuations in the financial market. The "Freedom Operation" plan, which was implemented for less than 24 hours, was announced to be over. However, it is believed that this was due to the expiration of the 60-day period for US military operations abroad without congressional authorization. Nevertheless, if the US and Iran can still reach a nuclear agreement in the coming period, will the US military launch another attack on Iran? In any case, the brief cessation of confrontation has given the financial market some breathing room.
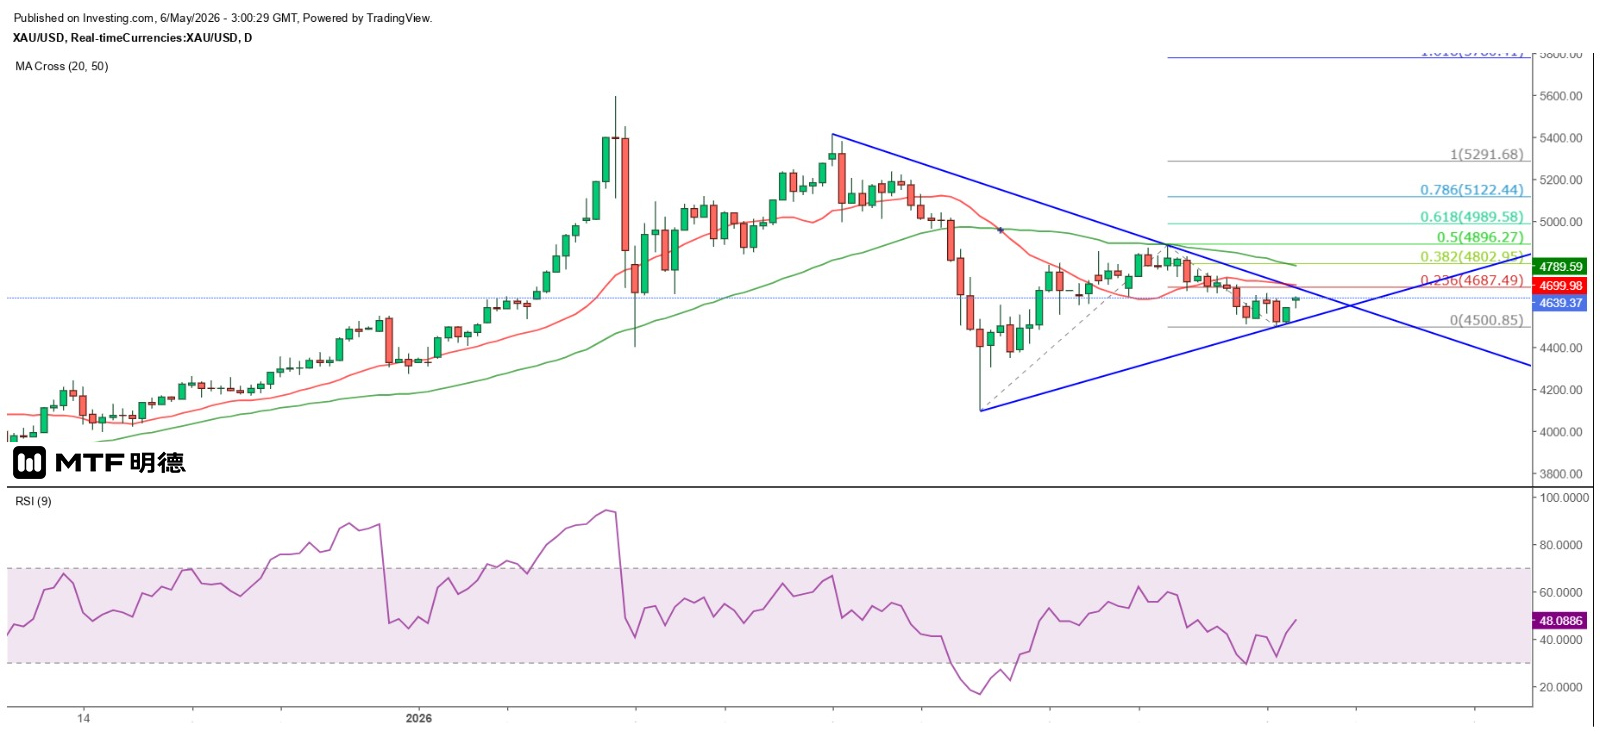
Gold prices have continued to rise as expected. The spot gold price has already broken through the $4,600 mark this morning, with the current high at $4,636.13. Whether it can break through the 38.2% retracement level of the biggest decline since April 17, which is $4,649.44, is crucial. On April 30, the price approached this level but failed to break through. The next day, it dropped to around $4,560. It then challenged this level again, breaking through briefly but failing to hold above it. Now, it is launching another attack. It is estimated that it can smoothly break through this level and challenge the strong resistance at the Gann Square level of $4,660. Subsequently, it can aim for the 50% and 61.8% retracement levels of the aforementioned biggest decline, which are $4,695.23 and $4,741.01 respectively.
From the daily chart, the low of $4,500.85 that gold made on Monday is very close to the 50% retracement level of the biggest rise since March 23, which is $4,494.29. After stabilizing and rebounding, it indicates that gold is likely to resume its upward trend. Measured by the Fibonacci extension, if the amplitude reaches 50%, the gold price could reach $4,896.27, and if it reaches 61.8%, it could reach $4,989.58. Whether a double top will be formed near the previous peak of $4,889.7 remains to be seen. In the short term, if the price continues to rise, $4,660 will still be a key resistance level. If it breaks through, the 20SMA ($4,657) and 50SMA ($4,892) will be the main technical resistance.
The above content is for reference only and does not constitute investment advice.
Previous Article Next Article


