
 Whatsapp
 Telegram
 2026-07-15
 The gold price is currently showing an upward flag pattern.
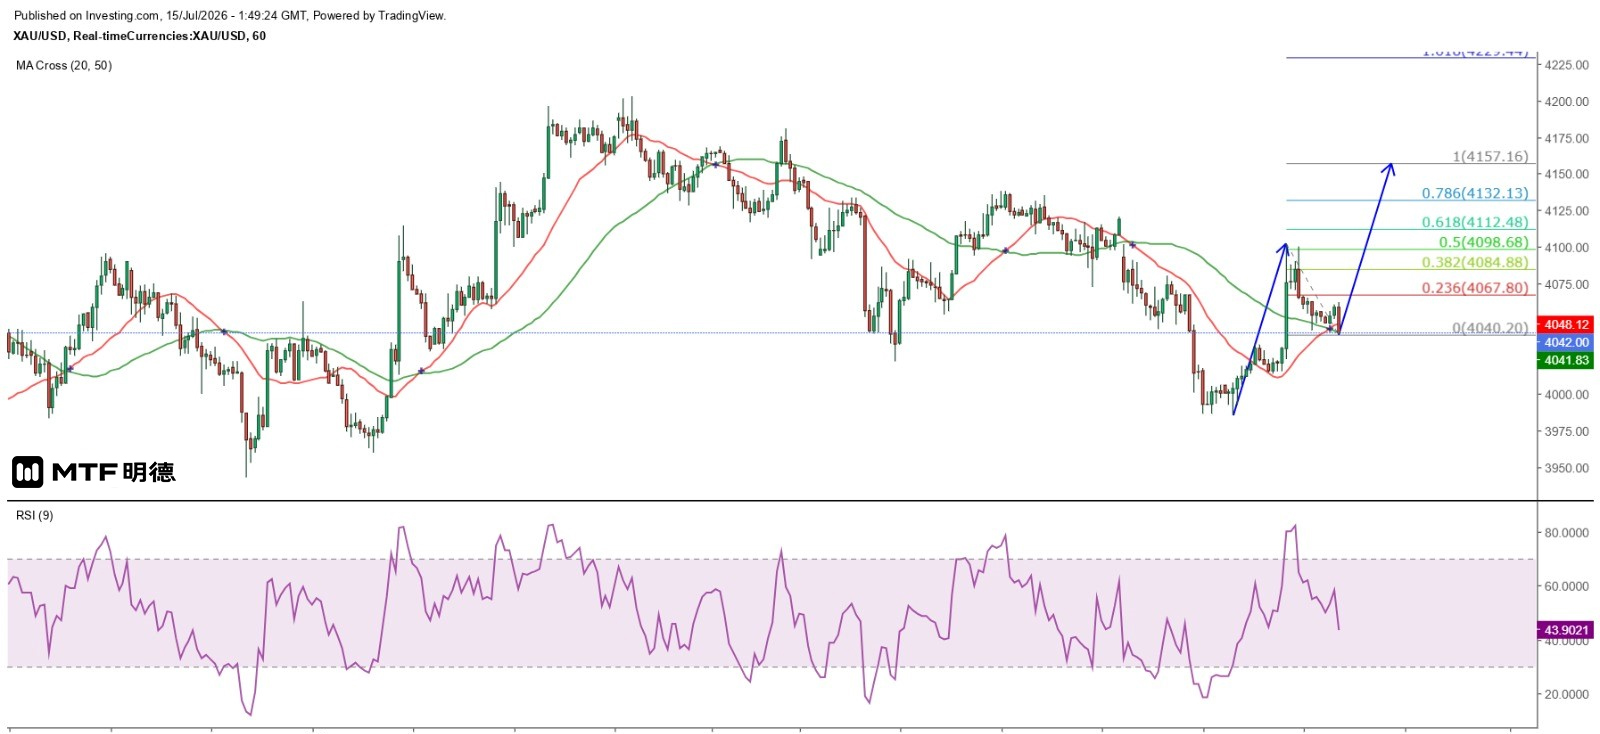
"Gold Price Forms a Short-Term Rising Flag Pattern" Completed on 15/7/2026 at 9:43
In response to events and data over the past two days, gold prices indicate that the market's main driver remains the U.S. interest rate trend, while the conflict between the U.S. and Iran in the Middle East only occasionally exerts temporary effects on gold. Yesterday, the U.S. released its June CPI data, showing that year-on-year inflation dropped sharply from 4.2% to 3.5%, while core CPI fell from 2.9% to 2.6%. On a month-on-month basis, overall inflation declined by 0.4%, whereas core inflation remained unchanged. All figures came in below expectations, prompting the market to reassess the likelihood of further Federal Reserve rate hikes this year.
CME's FedWatch predicts that the probability of the Federal Reserve keeping interest rates unchanged on July 29 has sharply risen from 58.3% to 84.5%, while the chance of a 25-basis-point rate hike in September has slightly declined from 51.2% to 50%. Meanwhile, the likelihood of maintaining current rates has significantly increased from 24.9% to 42.2%. This makes sense, as inflation at 3.5% remains above the Fed's 3% upper threshold. However, if crude oil prices remain below $80 per barrel in July, year-on-year oil price gains would further moderate, potentially bringing inflation down to 3% or lower. In such a scenario, the possibility of a rate hike this year would be eliminated, which could support gold prices.
After the release of U.S. inflation data, gold prices surged sharply, with spot gold rising from $4,028 to $4,089.75, then further climbing to $4,102.72 before retracing. It found support at around $4,069 and strengthened again, forming a double top after reaching as high as $4,100 ahead of London's close, which led to increased selling pressure. Prices later stabilized after dropping to a low of $4,043.2 in late New York trading, subsequently fluctuating within a range of approximately $4,048 to $4,060.
As seen on the hourly chart, gold remains in a downward trend over the past 76 days. However, since yesterday's New York session, the price has formed an ascending flag pattern. Measured by a 100% Fibonacci extension, gold is expected to rise toward $4,157.16 before facing resistance and potentially retracing. On a larger time frame, there is potential for gold to form a double-bottom reversal with the June 30 low, with the July 6 high of $4,202.49 acting as the neckline and serving as the next target for future price action.
The above information is for reference only and does not constitute investment advice.


