
 Whatsapp
 Telegram
 2026-07-06
 The short-term upward trend in gold prices could come to an end at any time.
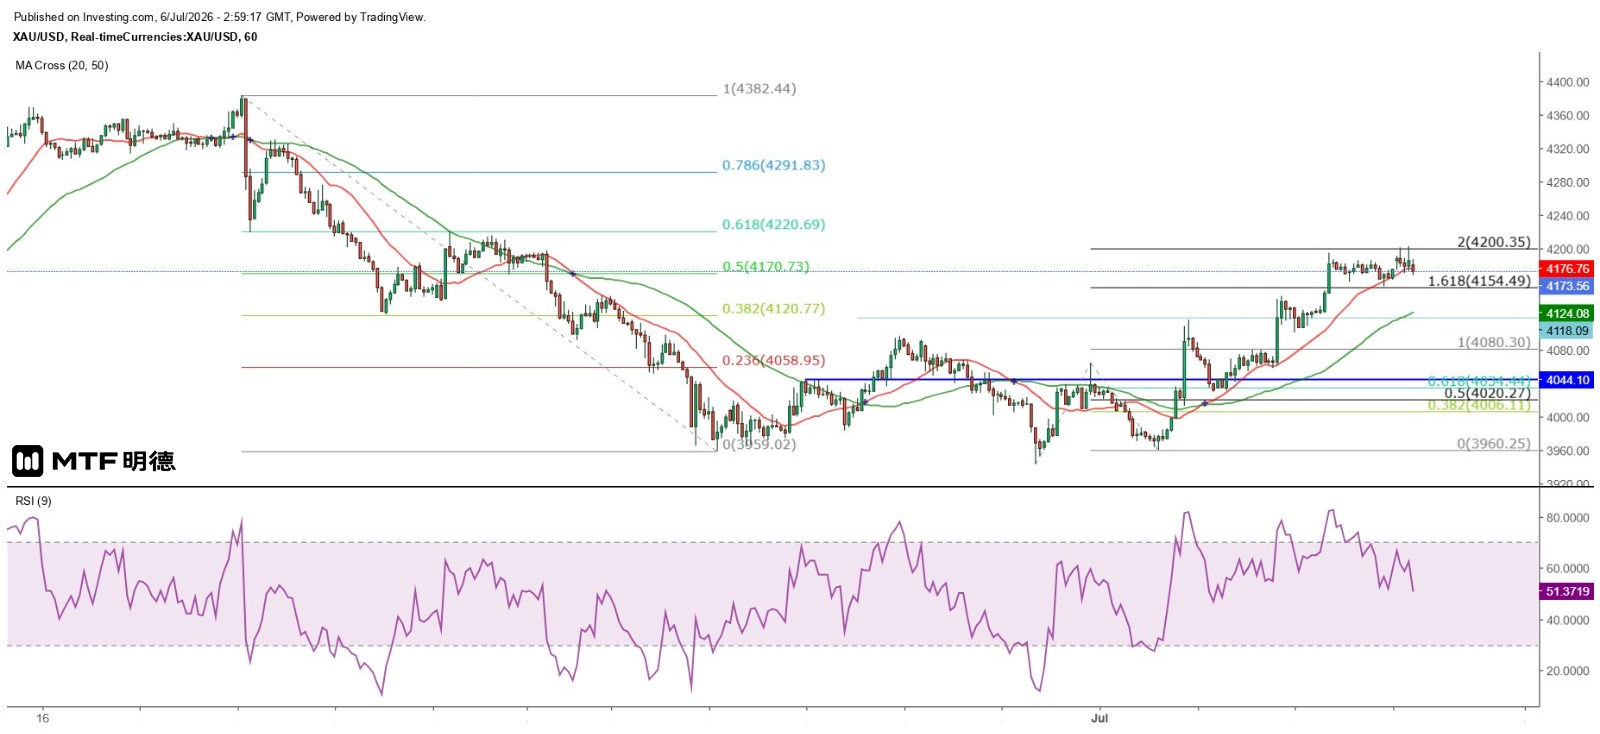
"Short-Term Gold Rally Could End Anytime" – Completed on 6/7/2026 at 10:58
Last Friday marked the U.S. Independence Day holiday, causing a closure of U.S. financial markets and resulting in gold prices trading in a narrow range after European markets reopened. This morning, gold opened with a gap higher. According to the hourly chart, spot gold surged twice above the $4,200 level, reaching a high of $4,202.49. However, it faced resistance around $4,200 and failed to hold above this level after two attempts, subsequently retreating and currently consolidating near the 20-period SMA at $4,176 on the hourly chart.
Last Friday, it was noted that gold prices were expected to face strong resistance near $4,210 at the 180-degree angle of Gann's square, with an anticipated upward trend continuing into early this week. The current price movement aligns with this forecast. On the hourly chart, after touching a low of $3,943.36 on June 30, spot gold rebounded to a high of $4,063.41 before correcting downward to a low of $3,960.25, completing a two-wave adjustment and initiating a third wave rally. Based on today's high, the third wave gain slightly exceeds twice the size of the first wave. If a fourth wave correction occurs in the short term, support is expected around $4,063.41.
Since the downtrend began on June 18, gold has rebounded by more than 50% of that decline (reaching 4170.73), and the 61.8% retracement level at $4220.69 clearly appears as a significant technical resistance on the hourly chart. Therefore, it is likely that the short-term upward move is nearing its end and will face a substantial correction. The first key support lies at the hourly 50SMA (4124); if this level breaks, prices could test 4080 or even 4063 for further support. On the other hand, note that last Friday gold broke above the daily 20SMA (4157). If gold closes above this line for three consecutive trading days, it may signal the start of a medium-term recovery wave, with the daily 50SMA (4392) becoming a potential target to challenge.
The above information is for reference only and does not constitute investment advice.


