


 Whatsapp
 Telegram
The gold price is currently at a critical juncture.
Gold Prices at a Critical Juncture
March 7, 2026, 10:43 AM
The U.S. added only 57,000 nonfarm jobs in June, far below the expected 114,000. The May job gain was also significantly revised downward from an initial reading of 172,000 to 129,000. The unemployment rate fell to 4.2% from 4.3%, while average hourly earnings rose 3.5% year-on-year, up from 3.4%. Leisure and hospitality lost 61,000 jobs, reflecting weaker-than-expected seasonal hiring compared to last year. The joint 2026 World Cup hosted by the U.S., Mexico, and Canada failed to stimulate a substantial surge in employment as anticipated. Other sectors, including professional and business services, social assistance, and healthcare, added 36,000, 25,000, and 22,000 jobs respectively. Overall, the labor market performance remained lackluster.
Moreover, the U.S. labor market continues to show structural slowdown, with lingering effects from post-pandemic overhiring, the impact of AI on employment, and ongoing demographic aging contributing to a drop in the labor force participation rate to 61.5% in June—the lowest since March 2021. Tightening immigration policies have also reduced labor supply. Additionally, high inflation, elevated interest rates, and geopolitical instability have made companies more cautious about hiring. The decline in the unemployment rate to 4.2% is primarily due to more people exiting the labor market rather than significant improvements in employment conditions.
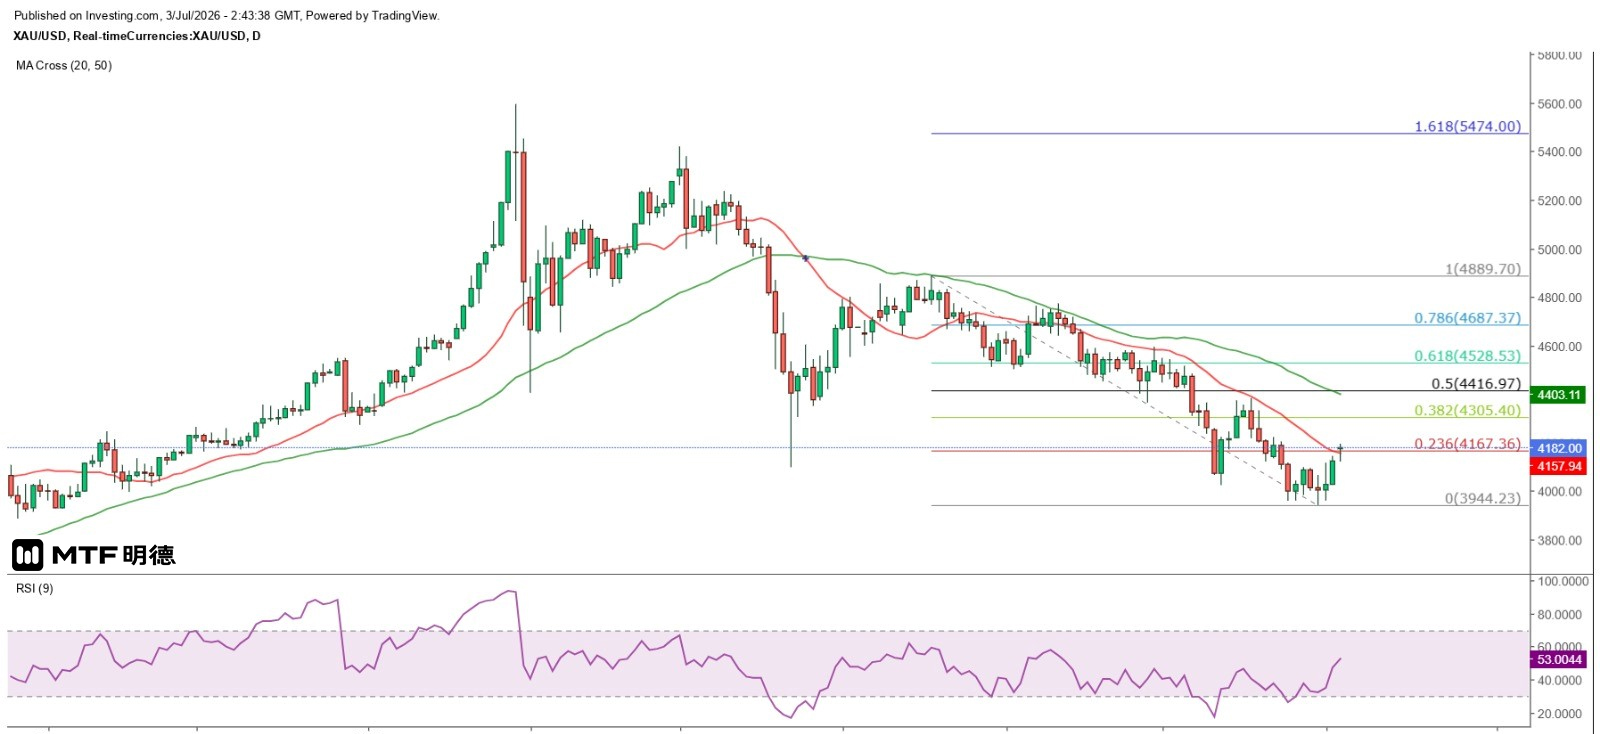
Data has cooled market expectations for a Federal Reserve rate hike in the second half of the year, causing the dollar to sharply decline and gold prices to surge. Spot gold jumped from around $4,060 to $4,144 before slightly retreating, but clearly held above $4,100. In early Asian trading today, it further advanced, reaching a high of $4,195.56. Since June 30, the cumulative rebound has already surpassed 50% of the largest drop recorded since June 18.
The gold price is currently at a critical juncture, with $4,210 located at the 180-degree angle of Gann's Square. The 61.8% retracement level from the aforementioned maximum decline stands at $4,214.71, suggesting strong resistance is expected as prices approach $4,210. Additionally, on the daily chart, gold has now broken above the 20SMA (currently around $4,157.7). A close above this level would mark the first such occurrence since May 14. If gold manages to close above the 20SMA for three consecutive trading days, a short-term rebound could unfold, with the next potential target or resistance level being the daily 50SMA (currently around $4,403). This short-term rally may extend into early next week.
The above information is for reference only and does not constitute investment advice.
Next Article


