
 Whatsapp
 Telegram
Candlestick
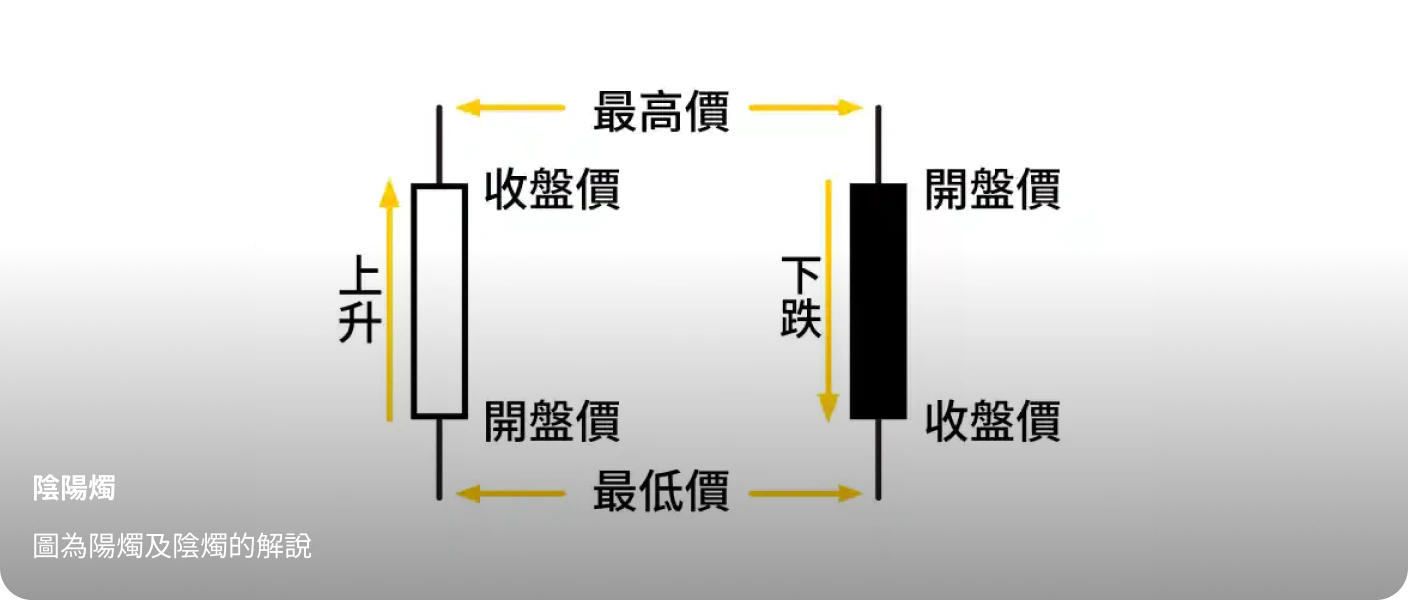
Candlesticks record the changes in open, close, high, and low prices during each period. A bullish candle represents a rising market, while a bearish candle represents a falling market. The upper shadow is above the body, and the lower shadow is below the body. Each period can be set to minutes, hours, days, weeks, months, or years, depending on whether investors need short-term or long-term entry. Candlestick combinations themselves can also form patterns that predict future price movements.
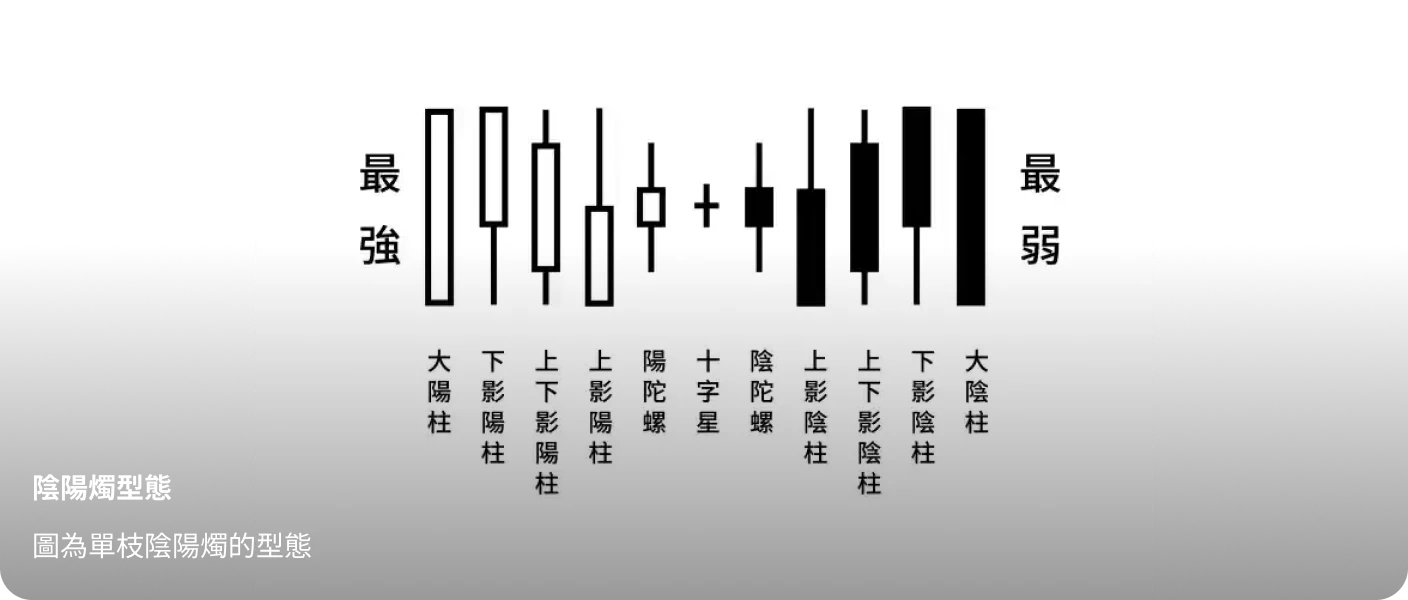
Candlestick Patterns
A Doji is a reversal pattern. If a Doji appears after a strong uptrend, the market is expected to fall, and vice versa. If a Doji appears after a strong downtrend, the market is expected to rise. A large bullish candle is the strongest signal, suggesting the uptrend may continue. A large bearish candle is the weakest signal, suggesting a bearish outlook.
Candlestick Combinations
By combining two or more consecutive candlesticks, patterns can be formed to predict future market performance. Here are some examples:
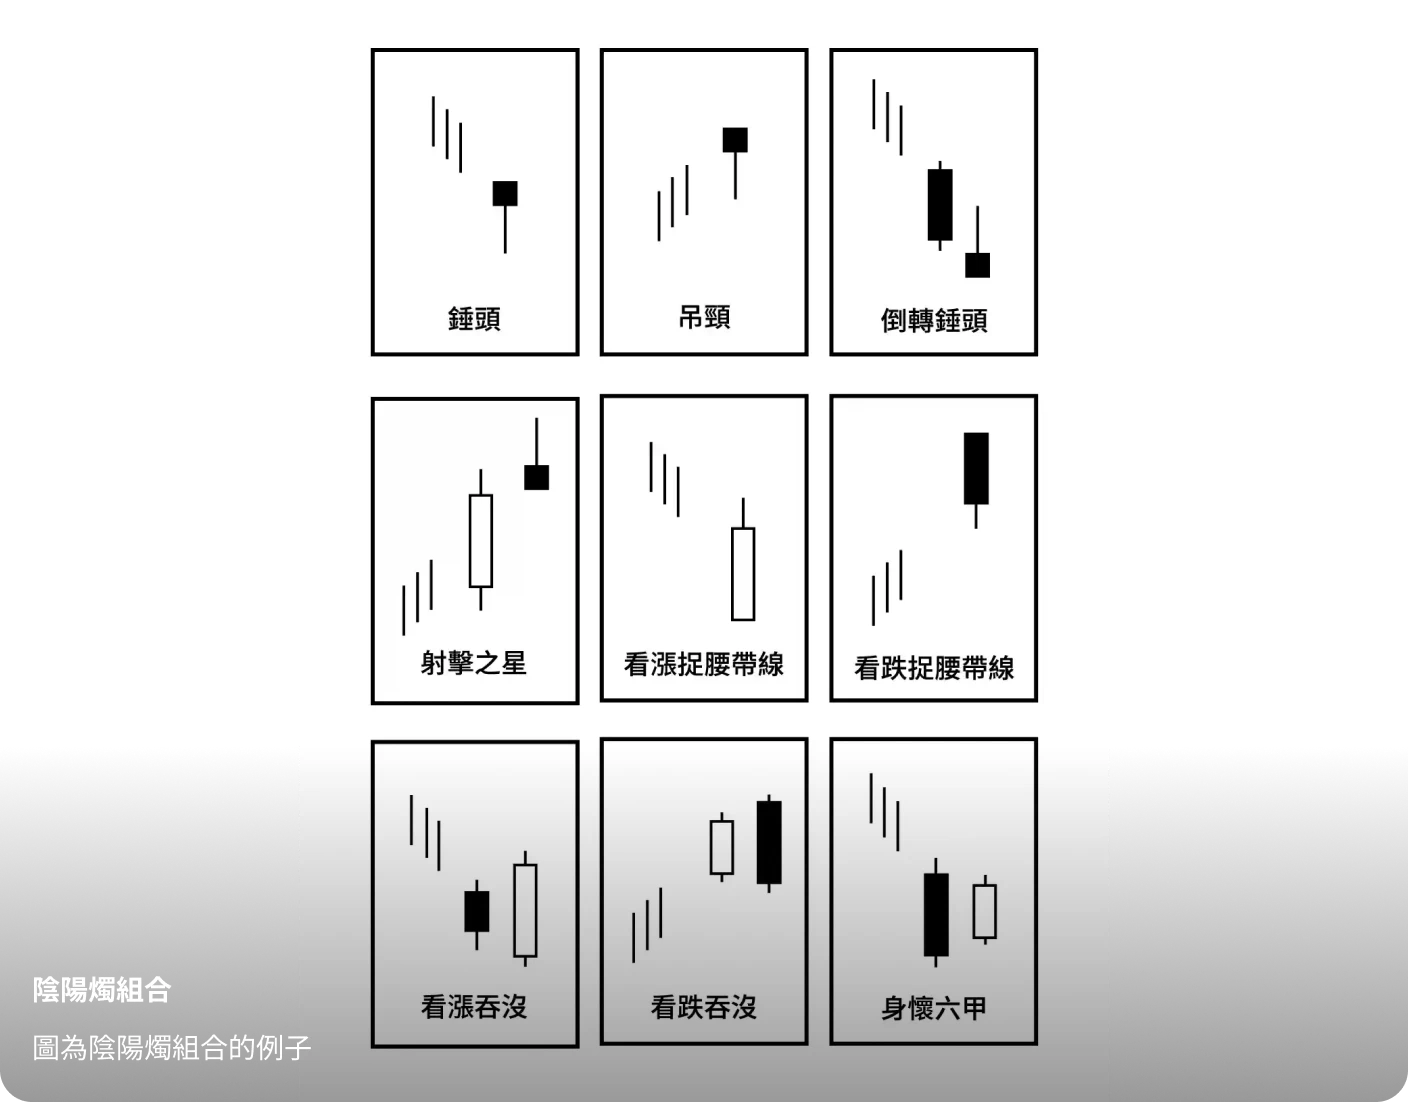
Pregnant Woman
A small bullish candle appears after a bearish candle
 Support at the bottom, buy signal
Engulfing Pattern
After a bullish candle, the next bearish candle rises first then falls below the previous open
Lack of buying support at the top, reversal and sell signalBottom Doji
A Doji appears after consecutive bearish candles
Reversal signal, market turning bullishDark Cloud Cover
A bearish candle opens higher after a bullish candle but has no upper shadow
Top signal, sell regardless of priceCounterattack Line
A large bearish candle appears after a large bullish candle
Top signal, sell regardless of priceThree White Soldiers
Support and Resistance
A support line is drawn by connecting two or more candlestick lower shadows or the bottom of the candle bodies. This line represents support. A resistance line is drawn by connecting two or more candlestick upper shadows or the top of the candle bodies. This line represents resistance. Besides candlesticks, K-lines or bar charts can also be used to draw these lines. When the price approaches the support line, it is a buy signal; when it nears the resistance line, it is a sell signal.
Trend
When support and resistance lines are drawn and both move upward in a balanced manner, an uptrend channel is formed. This indicates the market is likely to continue rising in the short term, and buying on pullbacks is recommended. Conversely, when both lines move downward in balance, a downtrend channel is formed. This suggests the market will continue to decline step by step, and selling on rallies is appropriate.
Breakout
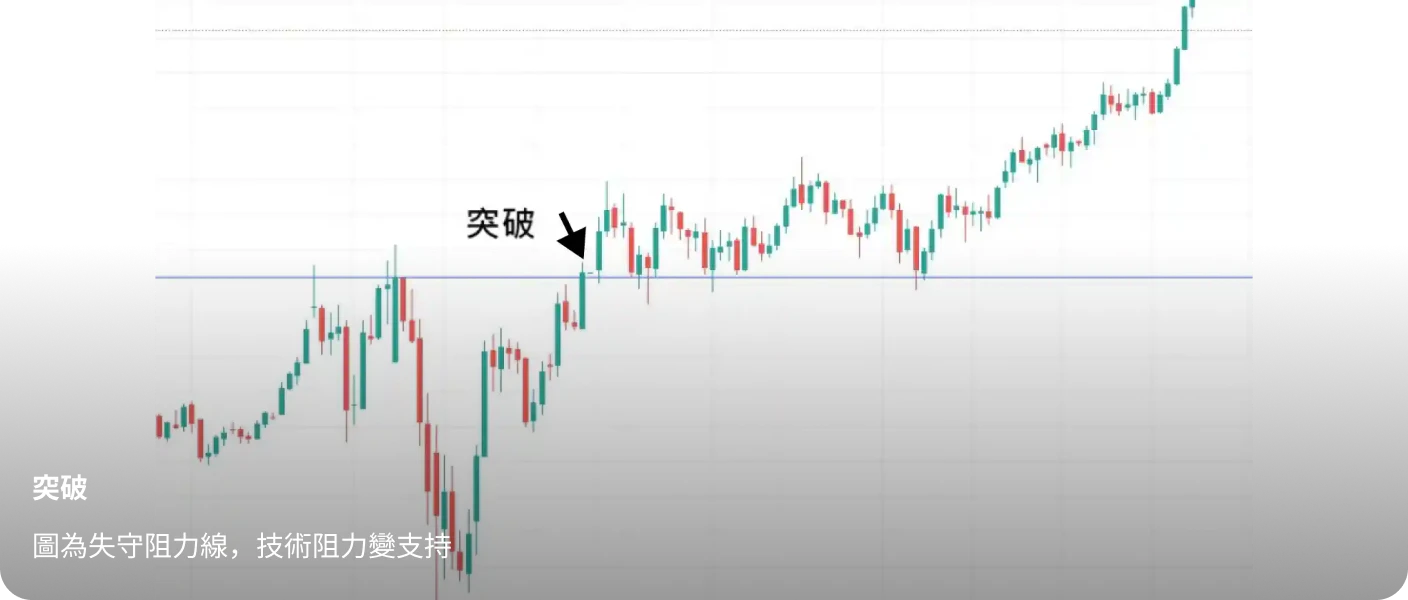
In PRICE ACTION, breakouts are one of the most important principles. When the price breaks above a resistance line or falls below a support line, it is considered a breakout signal. The price will then extend its upward or downward movement accordingly. After a breakout, traders can follow the trend to buy or sell. Once resistance is broken, it becomes support; once support is broken, it becomes resistance. Some patterns allow measuring the breakout magnitude to estimate target price levels. Breakouts can apply not only to uptrend or downtrend channels but also to other chart patterns.
Examples of Breakouts in Different Patterns
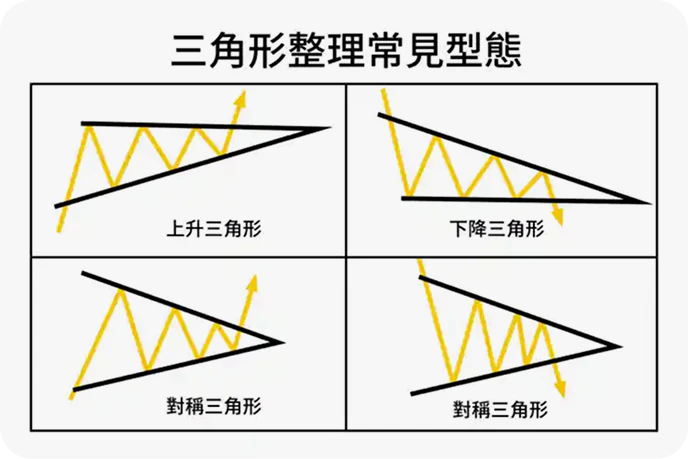
Triangle Breakout
Price range narrows as support and resistance lines converge
Buy if resistance is broken, sell if support fails. Target = breakout point + triangle’s final widthFlag Breakout
A flagpole followed by a shorter upward/downward channel
Buy if resistance is broken, sell if support fails. Target = breakout point + flagpole lengthBase Breakout
Long-term sideways movement at the bottom followed by breakout
Buy after breakout above resistance. Target = 3 to 10 times the base widthHead and Shoulders Top/Bottom
Left and right shoulders should be nearly symmetrical, with the head at least half higher/lower than the shoulders. Breakout occurs when the neckline is crossed
Breakout may trigger a pullback or continue directly. Buy/sell immediately at necklineElliott Wave Principle
This principle mainly predicts future trends through patterns and trend analysis. Since past price movements strongly indicate the trajectory of future prices, chartists often quote the saying: “Trend is your friend.” Before understanding what a trend is, investors usually start by learning candlesticks, support, resistance, and trend lines.
The theory assumes that market price movements follow specific patterns. By applying ratios and timeframes, these patterns can be identified and used for trading. The key rules include:
1. Wave 2 cannot fully retrace Wave 1
2. Wave 3 cannot be the shortest of the impulse waves
3. The low of Wave 4 cannot overlap with the peak of Wave 1
1. Wave 2 cannot fully retrace Wave 1
2. Wave 3 cannot be the shortest of the impulse waves
3. The low of Wave 4 cannot overlap with the peak of Wave 1
Technical Indicators (INDICATOR)
Technical indicators are statistical values calculated from past data using different parameters and formulas. These values can be used to judge market direction, as well as support and resistance levels. There are many different technical indicators in the market. Here we introduce some of the most commonly used ones and explain how they work.
Moving AverageCalculates the average closing price over different time periods, connecting daily averages to form a line.
The moving average itself acts as support and resistance. The 250-day average is often seen as the bull-bear dividing line. When the short-term line crosses the long-term line, a Golden Cross or Death Cross occurs, signaling buy or sell opportunities.
RSI (Relative Strength Index)Calculated using a specific formula, commonly with 9-day or 14-day parameters. The value ranges between 0 and 100.
Values above 50 indicate bullish conditions, below 50 indicate bearish. Above 80 suggests overbought, below 20 suggests oversold. RSI can also be used with trend analysis: if price is in an uptrend but RSI declines, a divergence occurs, signaling a potential drop, and vice versa.
MACDConsists of two lines, usually with parameters of 12 and 26. It is derived from moving averages and fluctuates around the zero line.
Crossing above zero is a bullish signal; crossing below zero is bearish. MACD can also be used with trend charts to identify divergences.
Bollinger BandsComposed of three lines based on moving averages and standard deviation. Prices tend to move within the band.
The bands themselves act as support and resistance. Trading above the middle line indicates a bull market, below indicates a bear market. If the bands narrow and then expand sharply, it signals a strong directional move.
Fibonacci RatiosBased on the concept of Fibonacci ratios, with 0.382 and 0.618 commonly used as retracement and rebound targets.
These ratios act as support or resistance. For example, if the price rises from 1 to 100 and peaks, retracement targets will be at 38.2% and 61.8%, where support may form before resuming the uptrend.


