


 Whatsapp
 Telegram
Silver is expected to challenge the $96 mark.
"Silver May Challenge $96" 10/3/2026 10:06 Completed
Yesterday, the New York oil price soared by over 30%, but was brought down by a single statement from Trump. Trump claimed that the US military operation against Iran would soon end, causing the New York oil price to plunge to a low of $81.25 in the late New York trading session yesterday. Although it rebounded slightly afterwards, it was clearly constrained by the 9SMA on the hourly chart (currently around $89.46). This morning in the Asian trading session, it rebounded slightly to $90.23 but was then blocked and fell back. It is expected to be constrained by $90. Even if it briefly breaks through, it is unlikely to rise above the top of the large bearish candle formed in the late New York trading session yesterday, which was $95.58.
Yesterday, it was observed that gold prices and oil prices were in an inverse relationship. The short-term outlook for oil prices suggests a further decline, which would allow gold prices to resume their upward trend. After hitting a low of $5,117.71 in the early Asian session today, the spot gold price closed with a long-tailed hammer on the hourly chart. After a period of consolidation, it rallied strongly and reached a new intraday high close to $5,169. The probability of it rising above $5,200 within the day is very high. If it breaks through the top of the sideways range formed since March 23, a simple measurement of the upward movement would suggest that the gold price could rise to $5,335. As mentioned yesterday, if we consider this as the third wave, the upward target would be $5,354.62.
The ratio indicates that the performance of silver prices will outshine that of gold prices.
The current gold-silver ratio has dropped below 60, with the lowest point reaching 43. A level of 50 can be regarded as a strong support since records began, meaning that when the ratio is below 50, the silver price outperforms the gold price. Observing the monthly chart, the gold-silver ratio has fallen from a peak of 107.27 in April last year to a low of 43.32 in January this year, approaching the maximum decline from March 2020 to February 2021 (the 100% extension of the decline target is 42.49), indicating that the silver price is likely to continue to rise. Therefore, it is possible that both gold and silver prices will rise, but the silver price will increase more; secondly, both gold and silver prices will fall, but the silver price will decline less; thirdly, the silver price will rise while the gold price will fall, which is less likely.
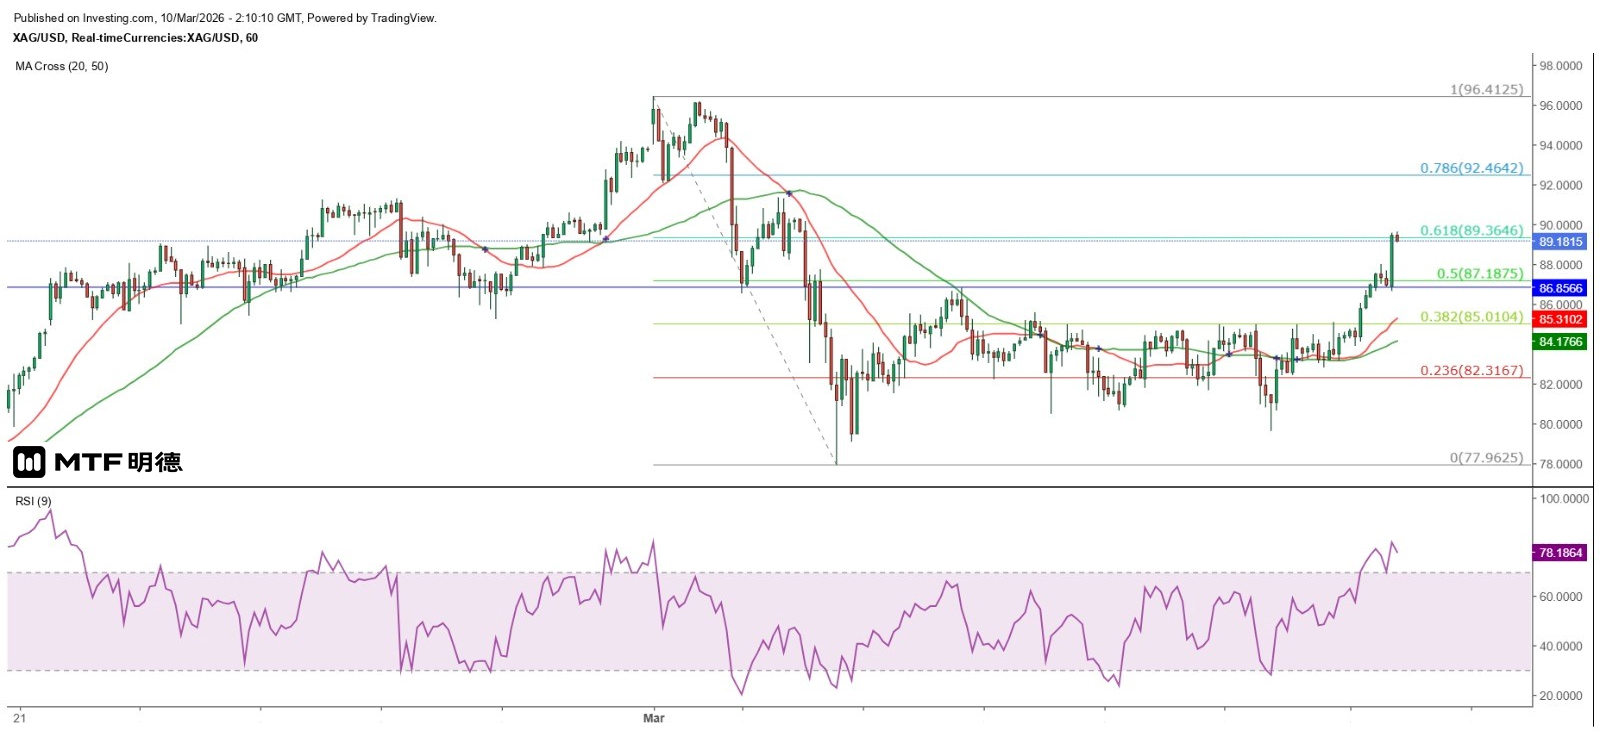
From the daily chart, the gold price pattern all indicates a greater chance of a medium-term decline. From the hourly chart, the gold price is still within the sideways range, while the silver price has broken upward, confirming that the silver price outperforms the gold price. The silver price is expected to challenge $96 in the short term!
The above content is for reference only and does not constitute investment advice.
Previous Article Next Article


