


 Whatsapp
 Telegram
The short-term adjustment in gold prices is unlikely to be complete.
"Gold Price Short-Term Adjustment Likely Unfinished" 15/1/2026 10:28 Finalized
Yesterday, the gold price exhibited extraordinary volatility. As seen from the 5-minute chart, after the European market opened, the spot gold price was below $4,640, fluctuating rapidly within about $15 to $20. It then plunged sharply at the beginning of the New York trading session, briefly touching below $4,600 before rebounding to around $4,626 and falling again. It hit a low of around $4,601 and then staged a double bottom rebound. At the end of the New York trading session, it slightly broke through and reached a new historical high of $4,643.18. However, it closed with a shooting star pattern. Although it rebounded again later, it lost momentum after rising to $4,641.6 and began a deeper correction wave, confirming that the Gann level angle at $4,660 indeed poses a significant resistance.
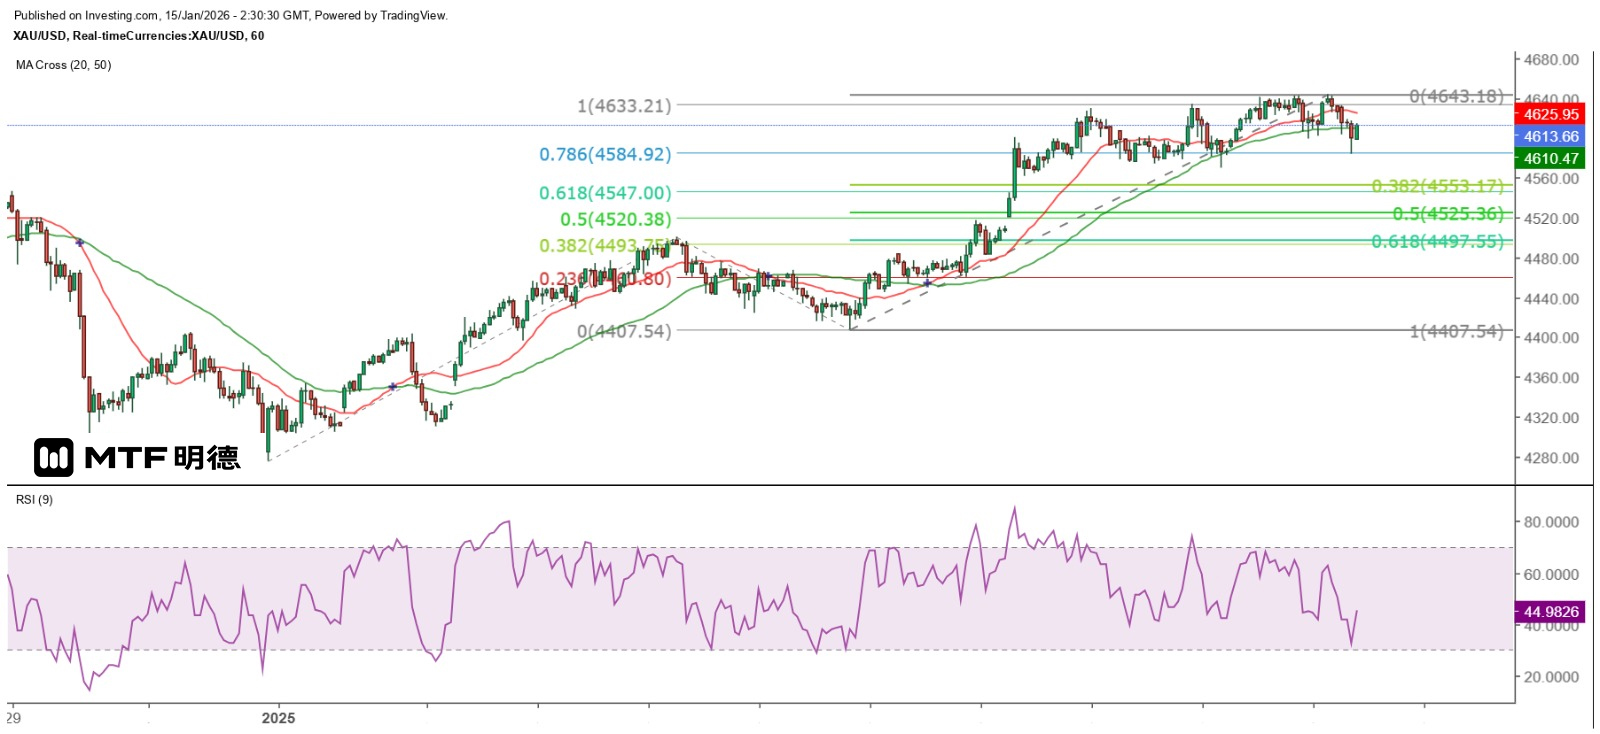
This morning, the spot gold price bottomed out at $4,584 and gradually rebounded. However, the 5-minute chart still shows a pattern of each wave being lower than the previous one. The first resistance level is approximately $4,618.5. From the hourly chart, the spot gold price has temporarily returned above the 50SMA at $4,610.4. Currently, the trading range can be divided into four parts. As of now, the gold price is expected to fluctuate between the 20SMA ($4,625.8) and the 50SMA on the hourly chart. If it breaks through and holds above the 50SMA, it may return to the higher trading range, that is, between the 50SMA and $4,660. Conversely, if it falls below the 50SMA, the gold price will continue to search for a bottom, and the possibility of testing $4,560 will increase.
$4,500 is the ultimate pullback target.
However, from the daily chart, gold closed with a bullish candle yesterday and reached a record high close, indicating that the gold price is still in an uptrend. A close below $4,585 would be the first bearish signal. However, it should be noted that the daily chart of the gold price has shown a divergence with the 9RSI. Once the bullish-bearish candlestick pattern confirms a bearish trend, investors should not ignore it. Additionally, using the Fibonacci extension to measure the movement since December 31, the gold price has slightly broken through the 100% extension level of $4,633.21. The subsequent sharp decline indicates that this level has significant resistance. Assuming that the gold price will not reach a new high, the ultimate adjustment targets for the next few trading days are $4,525 and $4,500.
The above content is for reference only and does not constitute investment advice.
Previous Article Next Article


