


 Whatsapp
 Telegram
Gold prices have entered a new round of trend market
"Gold Prices Have Launched a New Trend Market" 23/12/2025 10:30 Finalized
Gold prices have been surging with great momentum. Spot gold prices have broken through the $4,400 mark and continued to reach new highs. This morning in the Asian market, it hit a high of $4,490.66, approaching the $4,500 mark. This round of gold price rally is closely related to the Thanksgiving and Christmas market conditions. The previous breakthrough occurred on November 28th, right after the Thanksgiving holiday in the United States, when it broke through the descending trend line of the narrowing triangle, which was a clear technical breakthrough. After that, it consolidated sideways and broke above $4,300 on December 12th. It has since consolidated sideways without closing below that level. This time, it has broken through the peak and reached a new high before the Christmas holiday, indicating that it will continue to rise in the first half of next year.
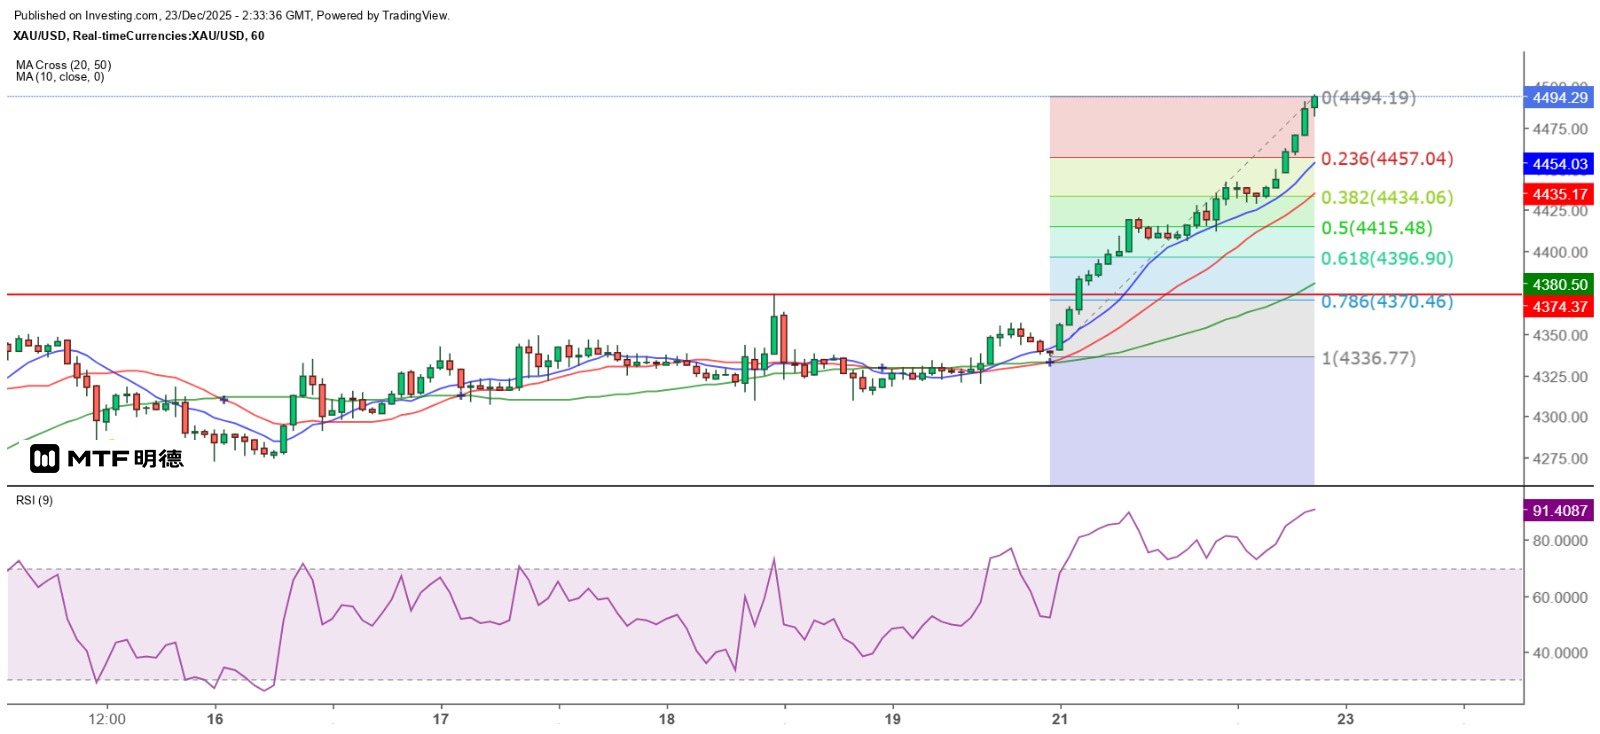
From the hourly chart, spot gold prices broke above the top of the sideways range of $4,374.37 since December 12 last Friday and have been climbing along the 10SMA (currently around $4,453). This is the first time I have mentioned the 10SMA because the price of gold often fluctuates around the 10SMA and it has lost its reference value. However, now that the gold price can remain stable and continue to rise below the 10SMA, it reflects a stable upward trend. In other words, closing below the 10SMA on the hourly chart can also be regarded as a signal of a decline. As of now, from the hourly chart, the upward trend after the break last Friday has not yet sent out a reversal signal.
This round of the uptrend is heading towards $5,000.
Spot gold prices have broken through the important resistance level of 4410 US dollars at the 270-degree vertical angle of Gann. This level will become an important support level for a potential pullback. Yesterday, it was mentioned that there was still a risk of a large double top on the daily chart for gold prices. However, after breaking through the top, no double-day reversal signal appeared within one or two days. Investors are now focusing on the short-term upward breakout trend. Additionally, whether the 9RSI still shows a double top divergence remains to be seen. Currently, the 9RSI corresponding to the previous top is 89.87, while the current 9RSI is 88.93, indicating a divergence still exists. Conversely, if the 9RSI breaks above the previous value, the divergence will disappear, and the pullback in gold prices will only be based on its overbought condition.
Judging from the current trend, $4,410 and $4,400 are important support levels for gold in the short term. $4,510 is at a 315-degree angle, so it is not a strong resistance level. The first strong resistance level is at $4,660. Further upward movement will encounter resistance at $4,810 at a 45-degree angle, but the resistance is also relatively weak. The next resistance level is at $4,960, as it is at a 90-degree angle, so the resistance is greater. At the same time, it is also close to the $5,000 mark, so the bulls and bears are expected to have a fierce battle. Currently, gold has entered a new trend market, which is relatively easier to operate.
The above content is for reference only and does not constitute investment advice.
Previous Article Next Article


